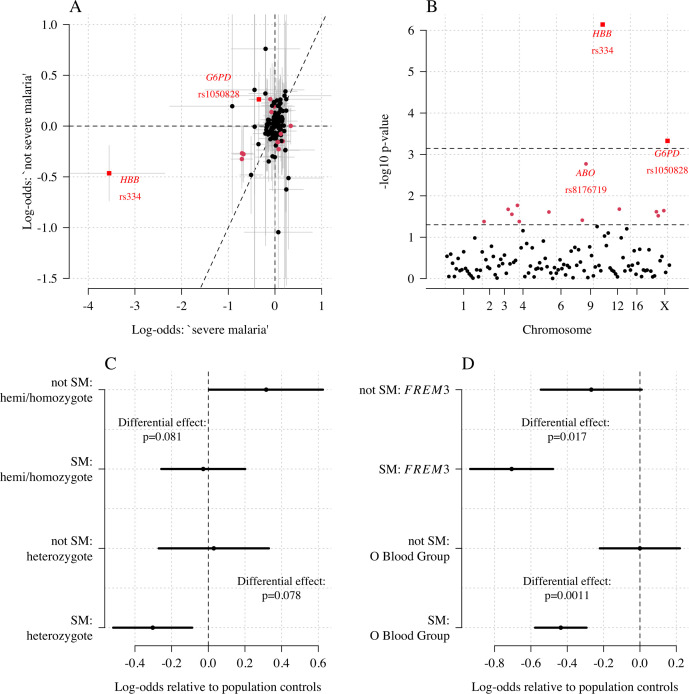
Figure 6. Exploring differential effects in 120 directly typed polymorphisms across 70 candidate malaria-protecting genes.
(A) Case-control effect sizes estimated for the ‘severe malaria’ sub-population versus the ‘not severe malaria’ sub-population (n = 3940 controls and n = 2220 cases, with approximately 1279 in the ‘severe malaria’ sub-population and 941 in the ‘not severe malaria’ sub-population). The vertical and horizontal grey lines show the 95% credible intervals. (B) The log10 p-values testing the hypothesis that the effects are the same for the two sub-populations relative to controls. The top dashed line shows the Bonferroni corrected significance threshold (assuming 70 independent tests). The bottom dashed line shows the nominal significance threshold. In both panels, red circles denote (nominal significance level), and red squares denote . (C) Analysis of the rs1050828 SNP (encoding G6PD + 202T) under a non-additive model (hemi/homozygotes and heterozygotes are distinct categories). This shows that heterozygotes are clearly under-represented in the ‘severe malaria’ sub-population and hemi/homozygotes are clearly over-represented in the ‘not severe malaria’ sub-population. (D) Evidence of differential effects for the O blood group (rs8176719, recessive model) and FREM3 (additive model).

