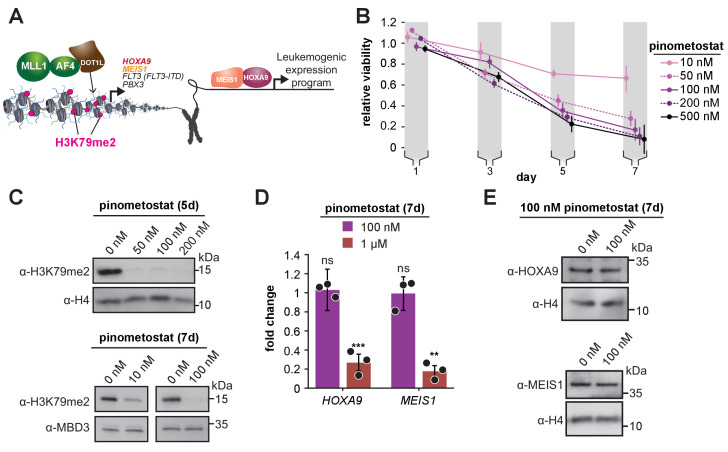
Figure 1. Low doses of DOT1L inhibitor ablate bulk H3K79me2 and curtail MV4;11 proliferation without impacting expression of canonical target genes.
(A) Conventional model depicting how DOT1L methyltransferase activity activates transcription of key proliferative oncogenic transcription factors (Okada et al., 2005; Bernt et al., 2011; Guenther et al., 2008; Armstrong et al., 2002; Zeisig et al., 2004; Kroon et al., 1998). (B) Proliferation assay of MV4;11 cells treated with the indicated concentrations of the DOT1L inhibitor pinometostat (EPZ5676). Cell viability was assayed every 2 days, starting 1 day after treatment commenced using the CellTiter Glo 2.0 reagent. Relative cell viability is presented as the mean fraction of pinometostat versus cells treated with the equivalent volume of DMSO from three independent experiments ± S.E.M. (C) Western blots for H3K79me2 with H4 or MBD3 loading controls in MV4;11 cells treated with 10–200 nM pinometostat for 5 or 7 days. (D) RT-qPCR analysis of HOXA9 and MEIS1 expression fold-change in MV4;11 cells treated with 100 nM or 1 µM pinometostat for 7 days. Results are shown as mean ± S.E.M. of three independent experiments. Student’s t-test (ns p > 0.05, ** p ≤ 0.01, *** p ≤ 0.001). (E) Western blot of HOXA9 and MEIS1 with H4 as a loading control from MV4;11 cells treated with 100 nM pinometostat for 7 days.


