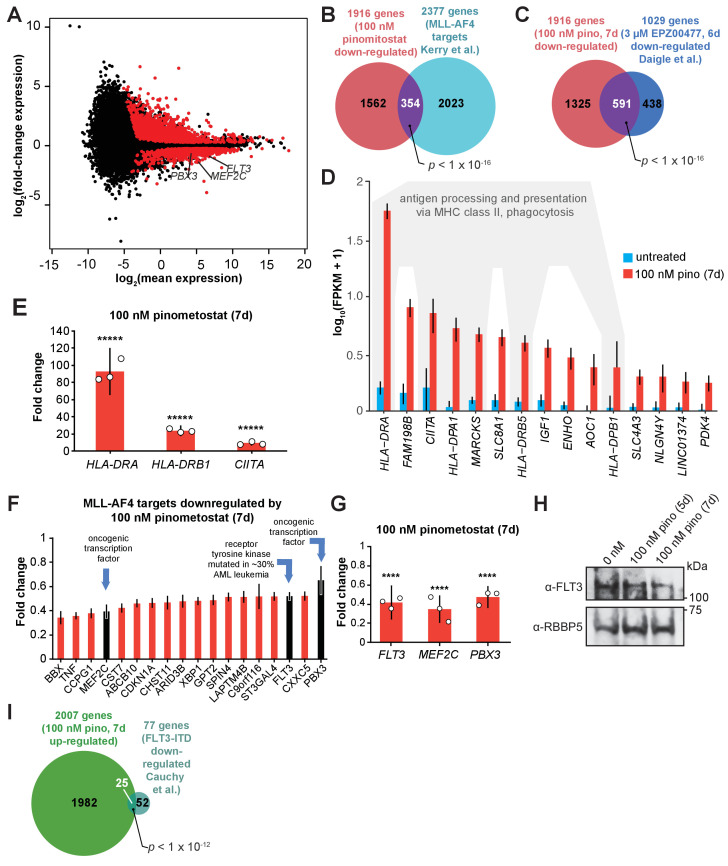
Figure 2. DOT1L inhibition downregulates a subset of MLL-AF4 targets including the leukemic oncogene FLT3.
(A) MA plot showing genes differentially expressed in MV4;11 cells treated with 100 nM pinometostat or DMSO 7 days as log2-mean of expression (FPKM) of the DMSO and pinometostat-treated samples versus the log2-fold change of the mean normalized pinometostat versus DMSO-treated FPKM for three independent replicates. Red represents genes that meet the significance threshold, with an FDR-adjusted p ≤ 0.5. (B) Venn diagram depicting overlapping genes between those downregulated by 100 nM pinometostat and MV4;11 MLL-AF4 targets identified by Kerry et al., 2017, p-value computed by two-tailed Fisher Exact test. (C) Venn diagram displaying the overlap between genes downregulated in MV4;11 cells by 100 nM pinometostat treatment (7 days) and treatment with 3 µM of the pinometostat-related compound EPZ004777 for 6 days (Daigle et al., 2011). p-Value computed by two-tailed Fisher Exact test. (D) Bar plot depicting upregulated genes with the highest fold changes from RNA-seq analysis of three independent experiments of DMSO- (blue) or pinometostat-treated (red) MV4;11 cells with uncertainty presented as the standard deviation computed by CuffDiff (Trapnell et al., 2012) with immune response genes outlined in gray. (E) RT-qPCR analysis showing the fold-change for HLA-DRA, HLA-DRB1, and CIITA gene expression in MV4;11 cells ± 100 nM pinometostat treatment for 7 days. Results are shown as mean ± S.E.M. of three independent experiments. Student’s t-test (*****p ≤ 0.00001). (F) Bar plot depicting the top pinometostat-downregulated genes from the RNA-seq analysis that are previously described MLL-AF4 targets (Guenther et al., 2008) including the oncogenes MEF2C, FLT3, and PBX3. (G) RT-qPCR analysis of MEF2C, FLT3, and PBX3 expression in MV4;11 cells ± with 100 nM pinometostat for 7 days. Results are displayed as mean fold-change ± S.E.M. of three independent experiments; Student’s t-test (**** p ≤ 0.0001). (H) Western blot for FLT3 with RBBP5 as loading control in MV4;11 cells treated with 100 nM pinometostat for 5 or 7 days. (I) Venn diagram displaying the overlap between genes upregulated in MV4;11 cells by 100 nM pinometostat treatment (7 days) and genes downregulated in leukemic cells from patients with FLT3-ITD vs normal FLT3 karyotypically normal AML (Cauchy et al., 2015). p-Value computed by two-tailed Fisher Exact test.


