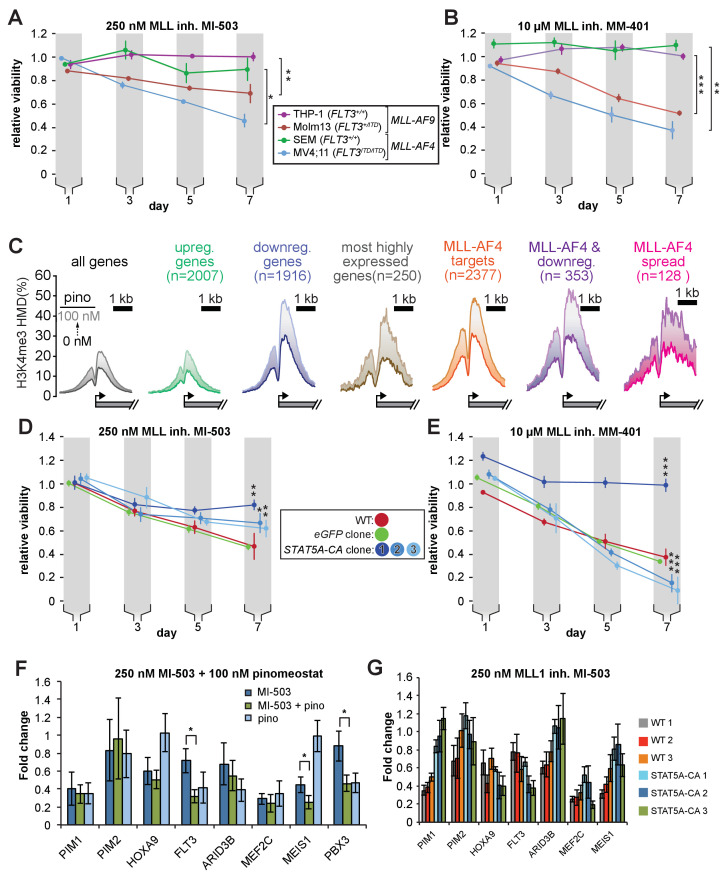
Figure 7. STAT5A-CA overexpression rescues the viability of MV4;11 cells treated with MLL1 inhibitors.
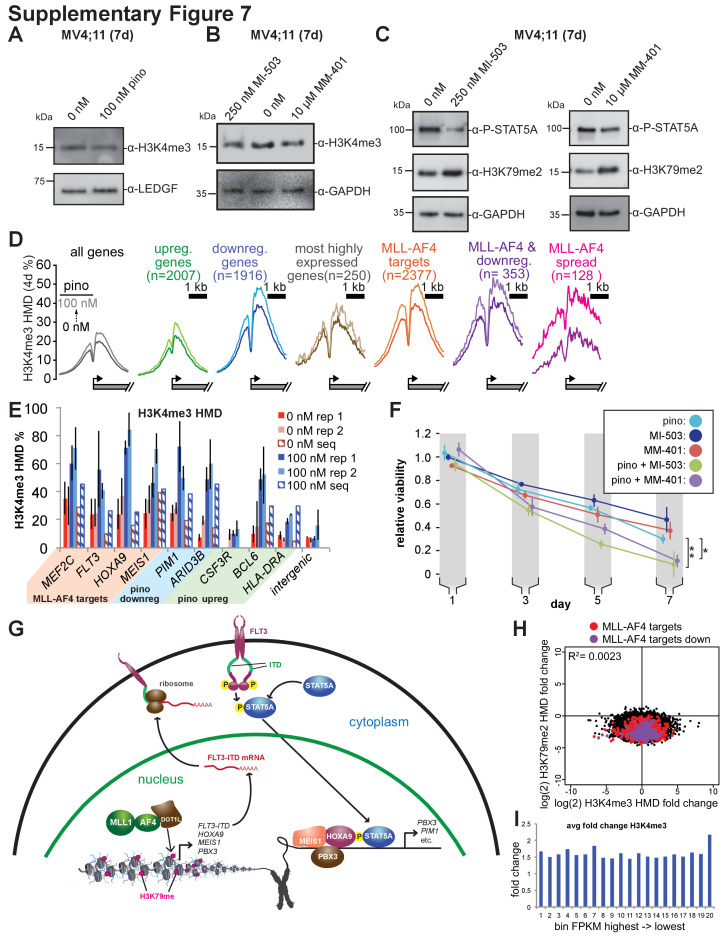
Proliferation assay of MLL-r cell lines treated with (A) 250 nM MI-503 (MLL1-Menin interaction inhibitor) or (B) 10 µM MM-401 (MLL1 histone methyltransferase inhibitor) for 7 days. Viability was measured by CellTiter Glo 2.0 assay and results are displayed as the fraction of luminescence of inhibitor-treated over DMSO-treated cells. Means ± SE are shown for three independent experiments. Student’s t-test (* p < 0.05, ** p < 0.01, *** p < 0.001). (C) H3K4me3 histone methylation density from −2000 to +2000 of the TSS from quantitative ICeChIP-seq from MV4;11 cells treated with 100 nM pinometostat for 7 days for genes up- or downregulated by 100 nM pinometostat, the most highly expressed genes, MLL-AF4 target genes (Kerry et al., 2017) as well as those MLL-AF4 targets downregulated by 100 nM pinometostat. (D and E) Proliferation assay of MV4;11 STAT5A-CA clonal isolates induced to express STAT5A-CA or eGFP with 1 µg/mL doxycycline and treated with D. 250 nM MI-503 or (E) 10 µM MM-401. Viability was measured and results displayed as in A and B. Means ± SE are shown for three independent experiments. Student’s t-test (* p < 0.05, ** p < 0.01, *** p < 0.001). (F) Gene expression analysis by RT-qPCR of MLL-fusion and STAT5a targets in MV4;11 cells treated with 250 nM MI-503 MLL1 inhibitor, 100 nM pinometostat DOT1L inhibitor or a combination for 7 days. Means ± S.E.M. are shown for three independent experiments (* p < 0.05). (G) Gene expression analysis by RT-qPCR of MLL-fusion and STAT5A targets in WT and STAT5A-CA MV4;11 cells treated with 250 nM MI-503 MLL1 inhibitor for 7 days. Means ± S.E.M. are shown for technical replicates of individual experiments.


