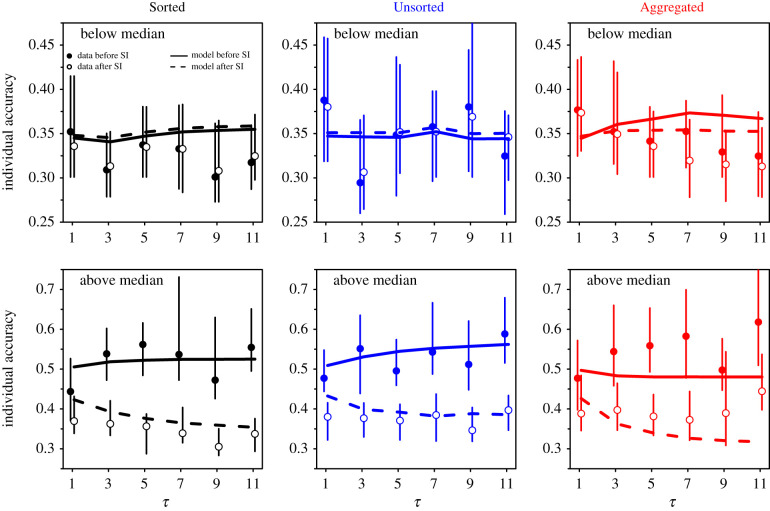
Figure 11.
Individual accuracy against the number of shared estimates τ, before (filled dots) and after (empty dots) social information sharing, in the Sorted (black), Unsorted (blue) and Aggregated (red) treatments. In each condition, the data were separated into sensitivities to social influence S lower than the median value of S in that condition, and sensitivities to social influence S higher than the median value of S. Solid and dashed lines are model simulations before and after social information sharing. Cases with below-median values of S (upper panels) had higher individual accuracy before social information sharing (i.e. values closer to 0) than cases with above-median values of S (lower panels). The latter, however, used more social information and thereby improved more. Error bars were computed using a bootstrap procedure described in the Statistical methods, and roughly represent 1 s.e.

