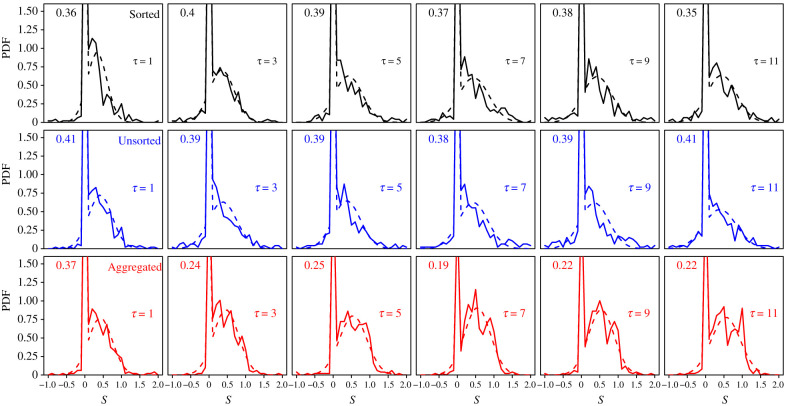
Figure 3.
Probability density function (PDF) of sensitivities to social influence S in the Sorted (black), Unsorted (blue) and Aggregated (red) treatments, for all values of τ. Solid lines are experimental data, and dashed lines fits using hurdle models (see Statistical methods). The weight (i.e. percentage of occurrences) P0 at S = 0 is shown at the topleft part of each panel.

