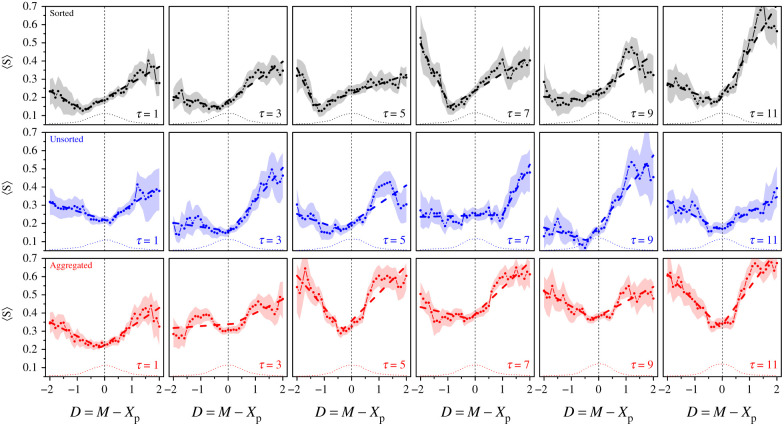
Figure 5.
Average sensitivity to social influence 〈S〉 against the distance D = M − Xp between personal estimate Xp and social information M, in the Sorted (black), Unsorted (blue) and Aggregated (red) treatments, for all values of τ. Dots are the data, and shaded areas roughly represent 1 s.e., and were computed using a bootstrap procedure described in the Statistical methods. Dashed lines are least-squares fits (see Statistical methods) and dotted bottom curves show the density of data at a given D in arbitrary units.

