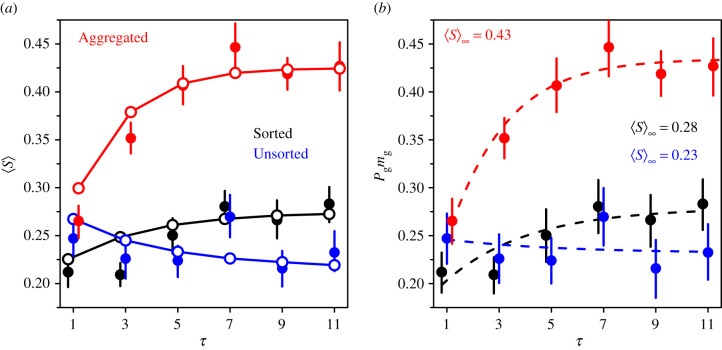
Figure 7.
Dependence of (a) the average sensitivity to social influence 〈S〉 and (b) Pg mg on the number of shared estimates τ, in the Sorted (black), Unsorted (blue) and Aggregated (red) treatments. Solid lines and empty circles in (a) are model simulations and dashed lines in (b) are fits produced by multiplying the analytical expression of Pg and mg (equation (5.3)), using the parameter values estimated in figure 4a,b. Error bars in (a) were computed using a bootstrap procedure described in the Statistical methods, and roughly represent 1 s.e. Error bars in (b) were computed by multiplying and , where Pgexp and mgexp are the values estimated in figure 4a,b, and and the corresponding errors. The fitted saturation value 〈S〉∞ is shown in each treatment in (b).

