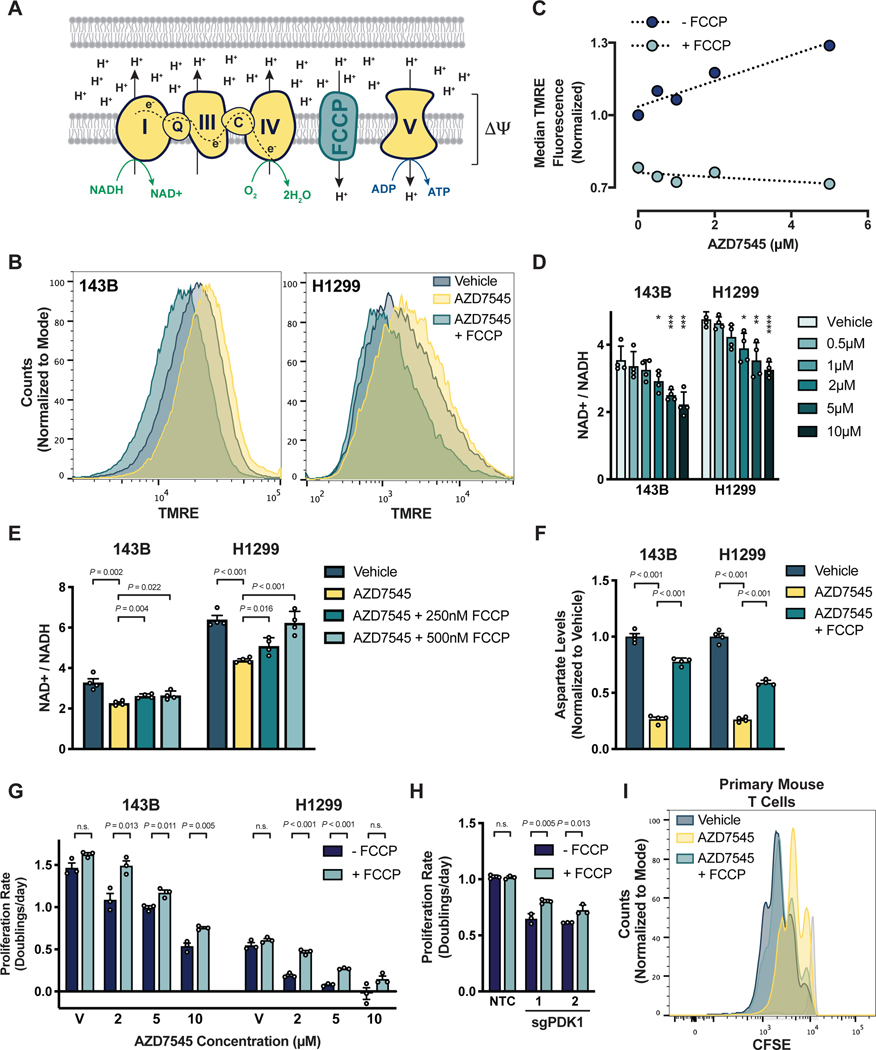
Figure 4. PDK inhibition induces mitochondria hyperpolarization and limits NAD+ regeneration by respiration.
(A) Schematic illustrating the mitochondrial electron transport chain and how FCCP (trifluoromethoxy carbonylcyanide phenylhydrazone) uncouples electron transfer from NADH to O2 from ATP production by the FoF1-ATP synthase (Complex V). ΔΨ denotes the mitochondrial membrane potential.
(B) Mitochondrial membrane potential, as reflected by TMRE (tetramethylrhodamine, ethyl ester) fluorescence, in 143B and H1299 cells treated with vehicle, 5 μM AZD7545, or 5 μM AZD7545 with 500 nM FCCP.
(C) Mitochondrial membrane potential, as reflected by TMRE fluorescence, in H1299 cells that had been treated with the indicated concentration of AZD7545, with or without 500 nM FCCP. TMRE fluorescence of 50,000 cells was quantified by flow cytometry and normalized to the vehicle-treated condition without FCCP.
(D) NAD+/NADH ratio of 143B and H1299 cells cultured in vehicle or AZD7545 for 5 hours (n = 4)
(E) NAD+/NADH ratio of 5143B and H1299 cells treated with vehicle, 5 μM AZD7545, or 5 μM AZD7545 with the indicated concentration of FCCP for 5 hours (n = 4).
(F) Aspartate levels in 143B and H1299 cells cultured in vehicle, 2 μM AZD7545, or 2 μM AZD7545 with 250 nM FCCP for 5 hours as measured by LCMS (n = 4).
(G) Proliferation rate of 143B and H1299 cells treated with vehicle (V) or AZD7545 with or without 500 nM FCCP as indicated (n = 3).
(H) Proliferation rate of 143B cells in which CRISPRi was used to repress PDK1 expression. Cells were transduced with sgPDK1 (two independently targeted lines) or sgNTC and cultured with or without 750 nM FCCP (n = 3).
(I) Proliferation of primary mouse T cells cultured in vehicle, 5 μM AZD7545, or 5 μM AZD7545 with 500 nM FCCP was assessed by CFSE dye dilution. Mouse T cells were stained with CFSE prior to stimulation with anti-CD3/CD28 antibodies and CFSE fluorescence was assessed by flow cytometry after 2 days. Stained, unstimulated cells (light grey) that did not proliferate are shown.
Values in panels D, E, F, G, and H denote mean ± SD. P values were calculated by unpaired, two-tailed Student’s t-test (*, **, ***, and **** denote P < 0.05, 0.01, 0.005, and 0.001; n.s. = not significant).

