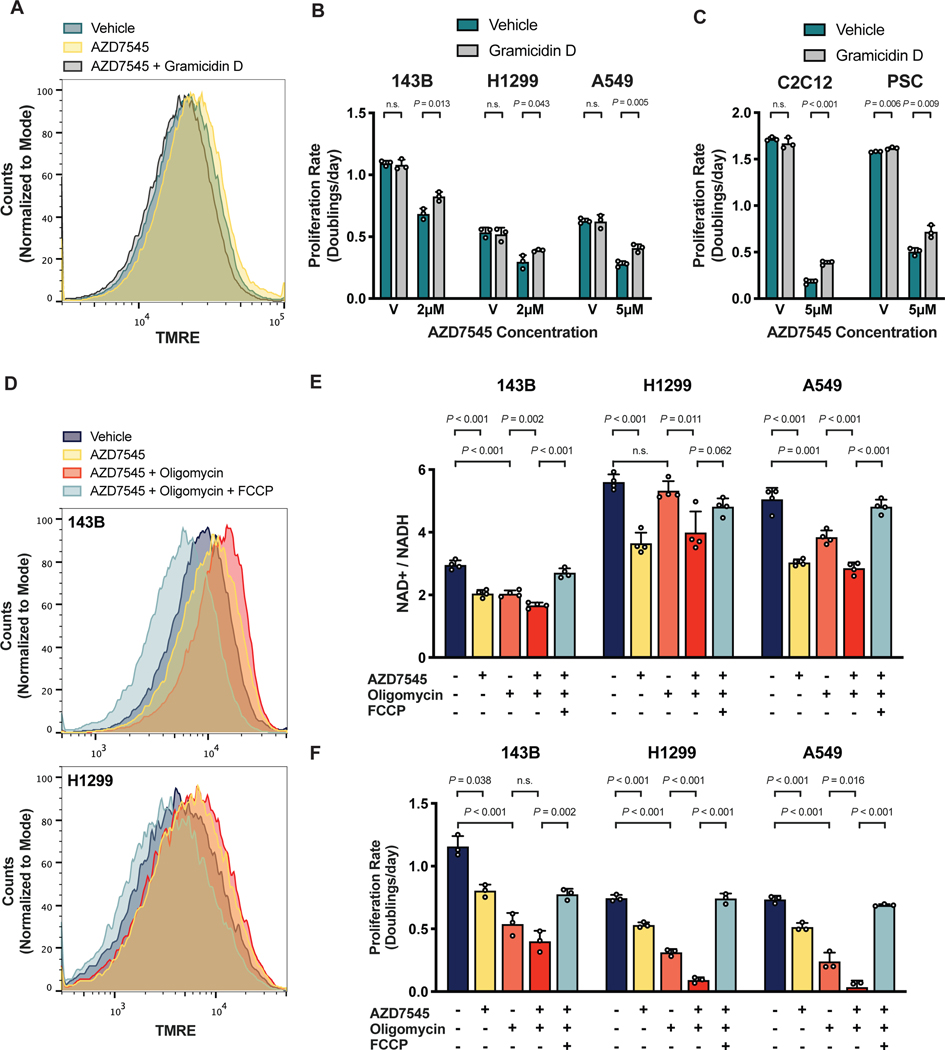
Figure 5. NAD+ regeneration by respiration is limited by the rate of mitochondrial ATP production.
(A) Mitochondrial membrane potential, as reflected by TMRE fluorescence, of 143B cells cultured in vehicle, 2 μM AZD754, or 2 μM AZD754 with 5 nM gramicidin D for 5 hours.
(B) Proliferation rate of 143B, H1299 and A549 cells treated with vehicle (V) or AZD7545 in the presence or absence of 0.5 nM gramicidin D (n = 3).
(C) Proliferation rate C2C12 myoblasts or pancreatic stellate cells (PSC) cultured with vehicle (V) or AZD7545 with or without 1 nM gramicidin D (n = 3).
(D) Mitochondrial membrane potential, as reflected by TMRE fluorescence, of 143B cells cultured for 5 hours with vehicle, 2 μM AZD7545, 1 nM oligomycin, and 1 μM FCCP as indicated.
(E) NAD+/NADH ratio of 143B, H1299, and A549 cells in vehicle, 5 μM AZD7545, 0.5 nM oligomycin, and 1 μM FCCP as indicated (n = 4).
(F) Proliferation rate of 143B, H1299, and A549 cells in vehicle, 5 μM AZD7545, 0.5 nM oligomycin and 1 μM FCCP as indicated (n = 3).
Values in panels B, C, E, and F denote mean ± SD. P values were calculated by unpaired, two-tailed Student’s t-test (n.s. = not significant).

