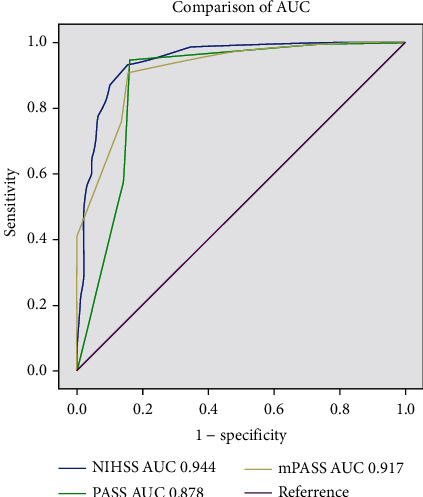
Figure 2.

Discrimination and calibration analysis: mPASS scale showed AUC 0.917, sensitivity 90.7%, and specificity 84.4%; the PASS scale showed AUC 0.878, sensitivity 94.5%, and specificity 83.9%; the NIHSS showed AUC 0.944, sensitivity 92.9%, and specificity 84.9%.
