
Figure 5.
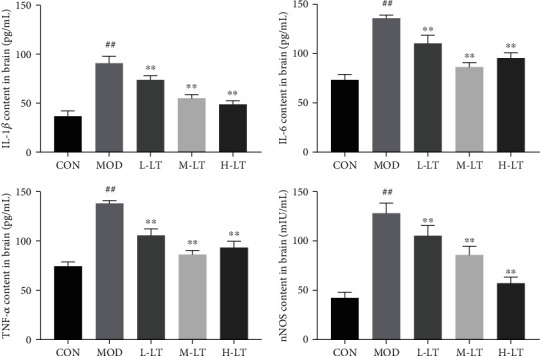
Concentrations of IL-1β, IL-6, TNF-α, and nNOS in rats' brain tissues of each group (n = 6). Compared with the CON group: #P < 0.05, ##P < 0.01; compared with the MOD group: ∗P < 0.05, ∗∗P < 0.01. L-LT: low-dose (100 mg/kg) l-theanine group; M-LT: medium-dose (200 mg/kg) l-theanine group; H-LT: high-dose (400 mg/kg) l-theanine group.