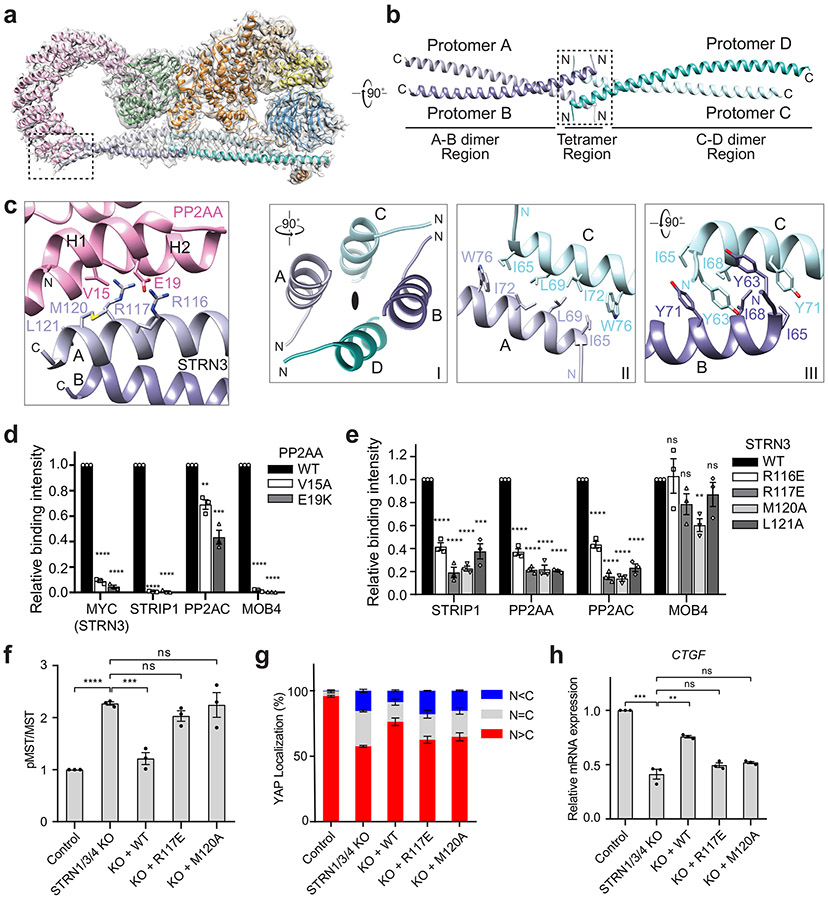
Fig. 2 ∣. Interactions between PP2AA and the STRN3 CC tetramer.
a, Cryo-EM density map and atomic model of human STRIPAK core at a resolution of 3.5 Å. b, Cartoon representation of the STRN3 CC tetramer. Protomers A-D are colored light blue, slate, cyan and teal, respectively. (Below) Detailed views of the boxed tetramer region: (I) Overall view of tetramer interface. The black oval indicates the 2-fold symmetry axis. (II) Interface between protomer A and C. (III) Interface between protomer B and C. c, Zoomed-in view of the interface between PP2AA and STRN3 CC expanded from the boxed region in a. d, Quantification of the relative binding intensity between the indicated STRIPAK core components and FLAG-tagged PP2AA wild type (WT) or its mutants in 293A cells, derived from co-immunoprecipitation (co-IP) experiments. e, Quantification of the relative binding intensity between the indicated STRIPAK core components and FLAG-tagged STRN3 WT or its mutants in STRN1/3/4 KO 293A cells, derived from co-IP experiments. The relative binding intensities of the mutants (d,e) were normalized against the WT (100%). f, Mock vector or indicated plasmids were transfected in control or STRN1/3/4 KO 293A cells. The pMST and MST levels were quantified based on immunoblots of transfected cell lysates. The quantified values were used to calculate the ratios. g, Quantification of YAP localization based on immunofluorescence staining of YAP. Approximately 100 cells were counted for quantification. N<C (blue), N=C (grey), and N>C (red) categories indicate YAP localization in cytoplasm, both cytoplasm and nucleus, and nucleus, respectively. h, Relative CTGF gene expression based on qRT-PCR analysis. Data in d–h are mean ± SEM of three independent experiments. Results were evaluated by Two-tailed unpaired t tests (*, P<0.05; **, P<0.01; ***, P<0.001; ****, P<0.0001; ns, non-significant). Source data for graphs are available online.

