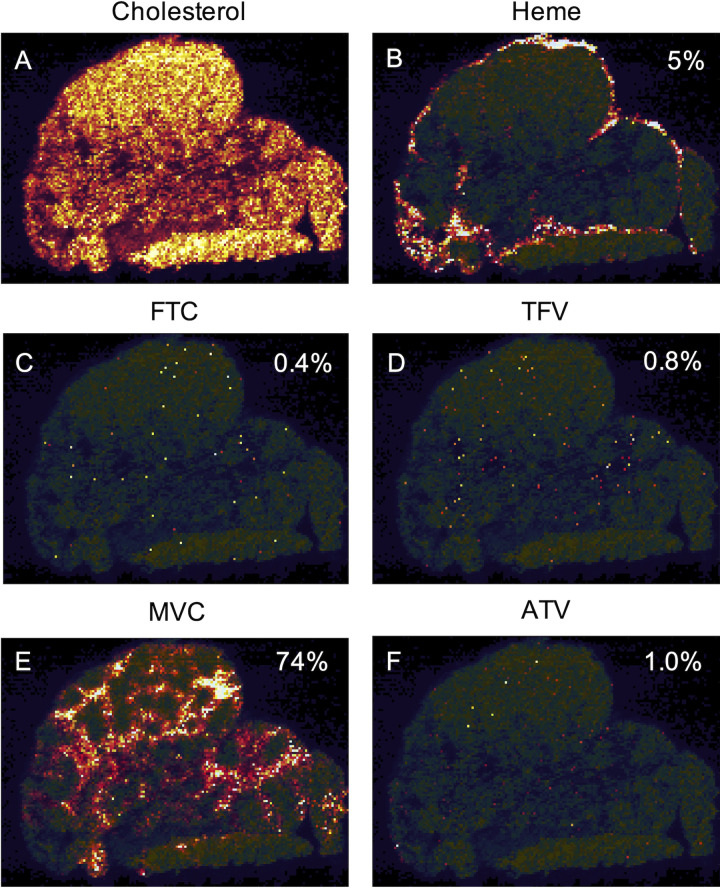
FIG 1.
Representative intensity-scaled MSI images of the distribution of cholesterol (A), heme (B), emtricitabine (FTC) (C), tenofovir (TFV) (D), maraviroc (MVC) (E), and atazanavir (ATV) (F) in RT-SHIV+ NHP 42966. The percentage of MLN area covered by each target is indicated in each image. Brighter colors (white and yellow) represent higher MSI signal intensity, while darker colors (black and red) represent lower MSI signal intensity.

