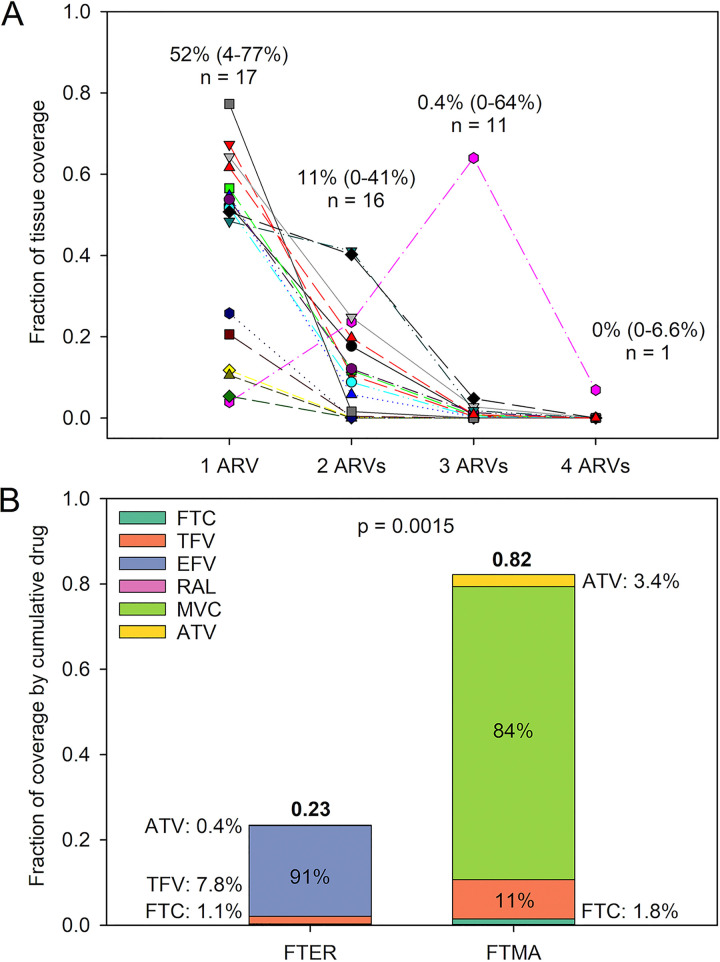
FIG 2.
(A) Fraction of MLN area covered by some or all of the ARVs in the 4-drug regimen. The median (range) percentage of coverage and the sample size are given for each number of ARVs. (B) Median fraction of MLN coverage by each of the 4-drug regimens compared by Student’s t test. The percent contribution of each ARV to the regimen’s cumulative coverage is also shown.

