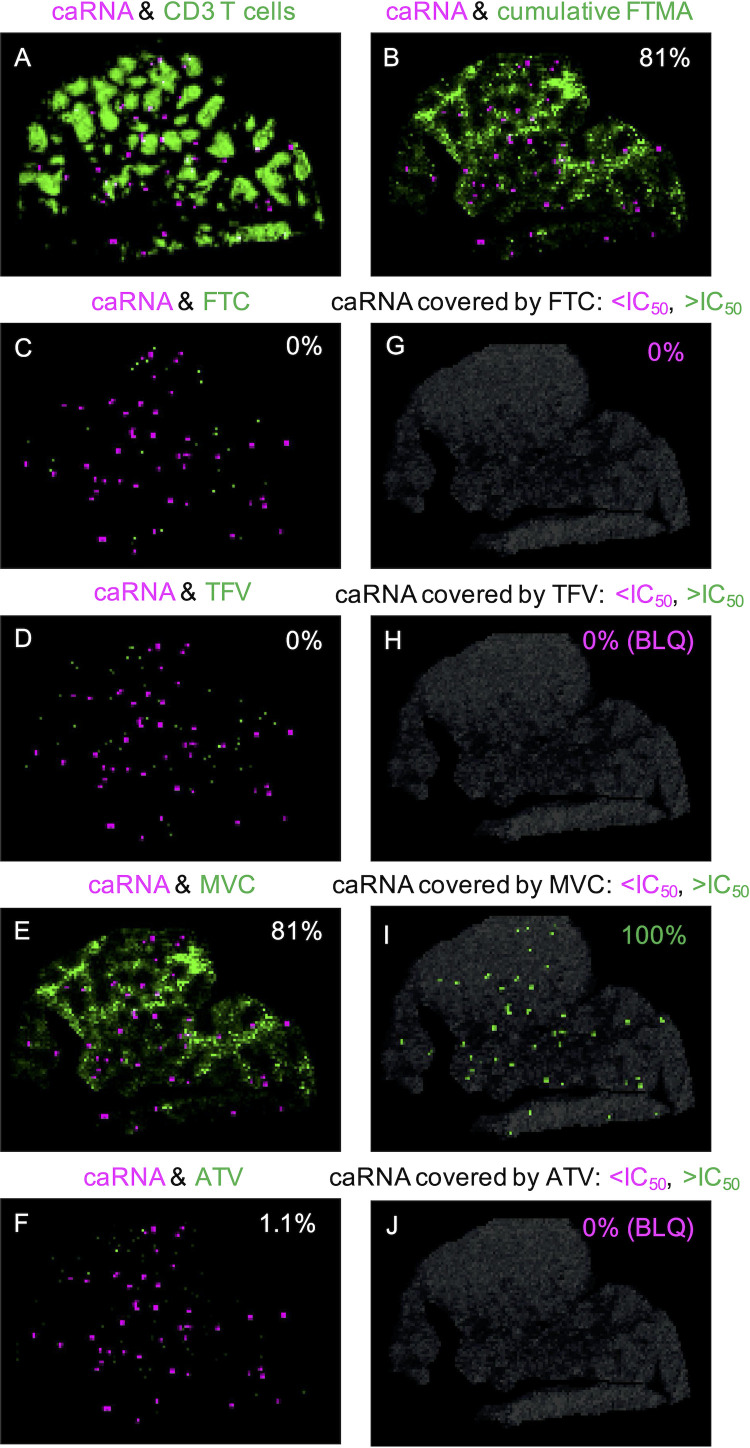
FIG 4.
(A to F) Representative images of the colocalization between caRNA (magenta) and other targets (green) in RT-SHIV+ NHP 42966: caRNA and CD3+ T cells (A), caRNA and cumulative FTMA (B), and caRNA and individual ARVs, with the percentage of colocalization indicated in each image (C to F). (G to J) Images of only drug-covered caRNA, with the percentages below (magenta) and above (green) the IC50 indicated in each image.

