FIG 5.

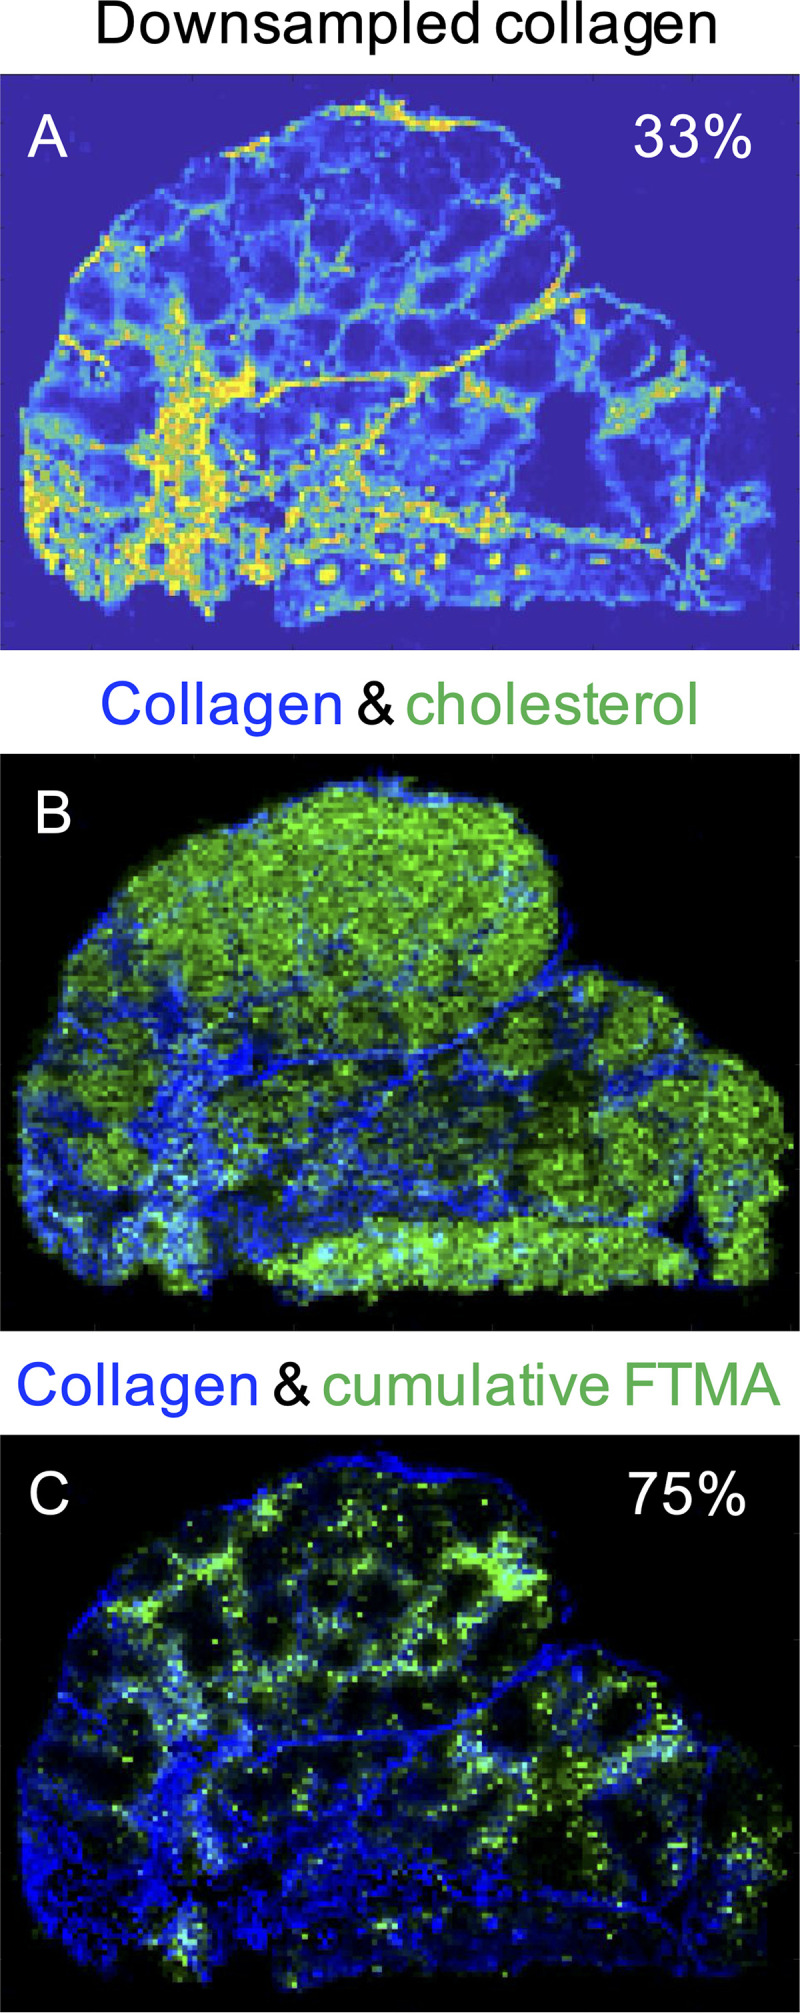
Representative images of the distribution of downsampled collagen (A), coregistered collagen (blue) and cholesterol (green) (B), and collagen and cumulative FTMA regimen coverage (C) in RT-SHIV+ NHP 42966. The percentage of MLN area covered by collagen is indicated in panel A, and the percentage of overlap between collagen and FTMA is indicated in panel C.
