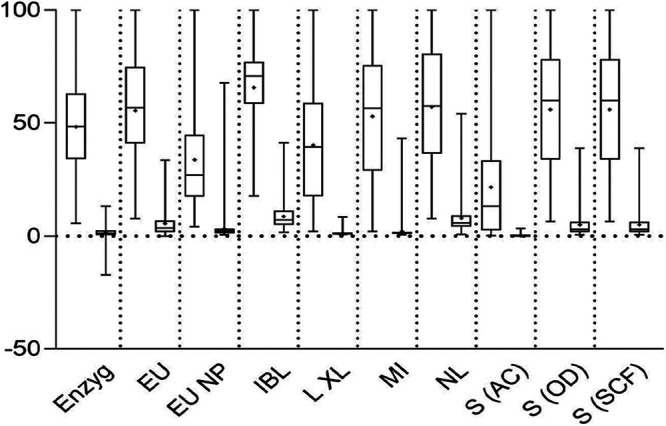
FIG 1.

Box plot of output values for each method by sample set, normalized to 100. Each pair corresponds to a test method, with the left plot of each pair representing the output data of the measles samples and the right plot, the non-measles samples. Open bars capture the middle 50% of the values, specifically, from the first quartile (bottom of bar) to the third quartile (top of the bar). The whiskers extend from the minimum to maximum values. The dividing line in the open bars indicates median values. Plus signs (+) indicate mean values. Due to differing test method OD data manipulations generating output values of differing scales, the maximum value for each test kit was set to 100, and all other values were normalized to this value. Enzyg, Enzygnost; EU, Euroimmun; EU NP, Euroimmun NP; L XL, LIAISON XL; MI, Microimmune; NL, NovaLisa; S (AC), Serion (activity calculator result determination method); S (OD), Serion (OD range result determination method); S (SCF), Serion (special case formula result determination method).
