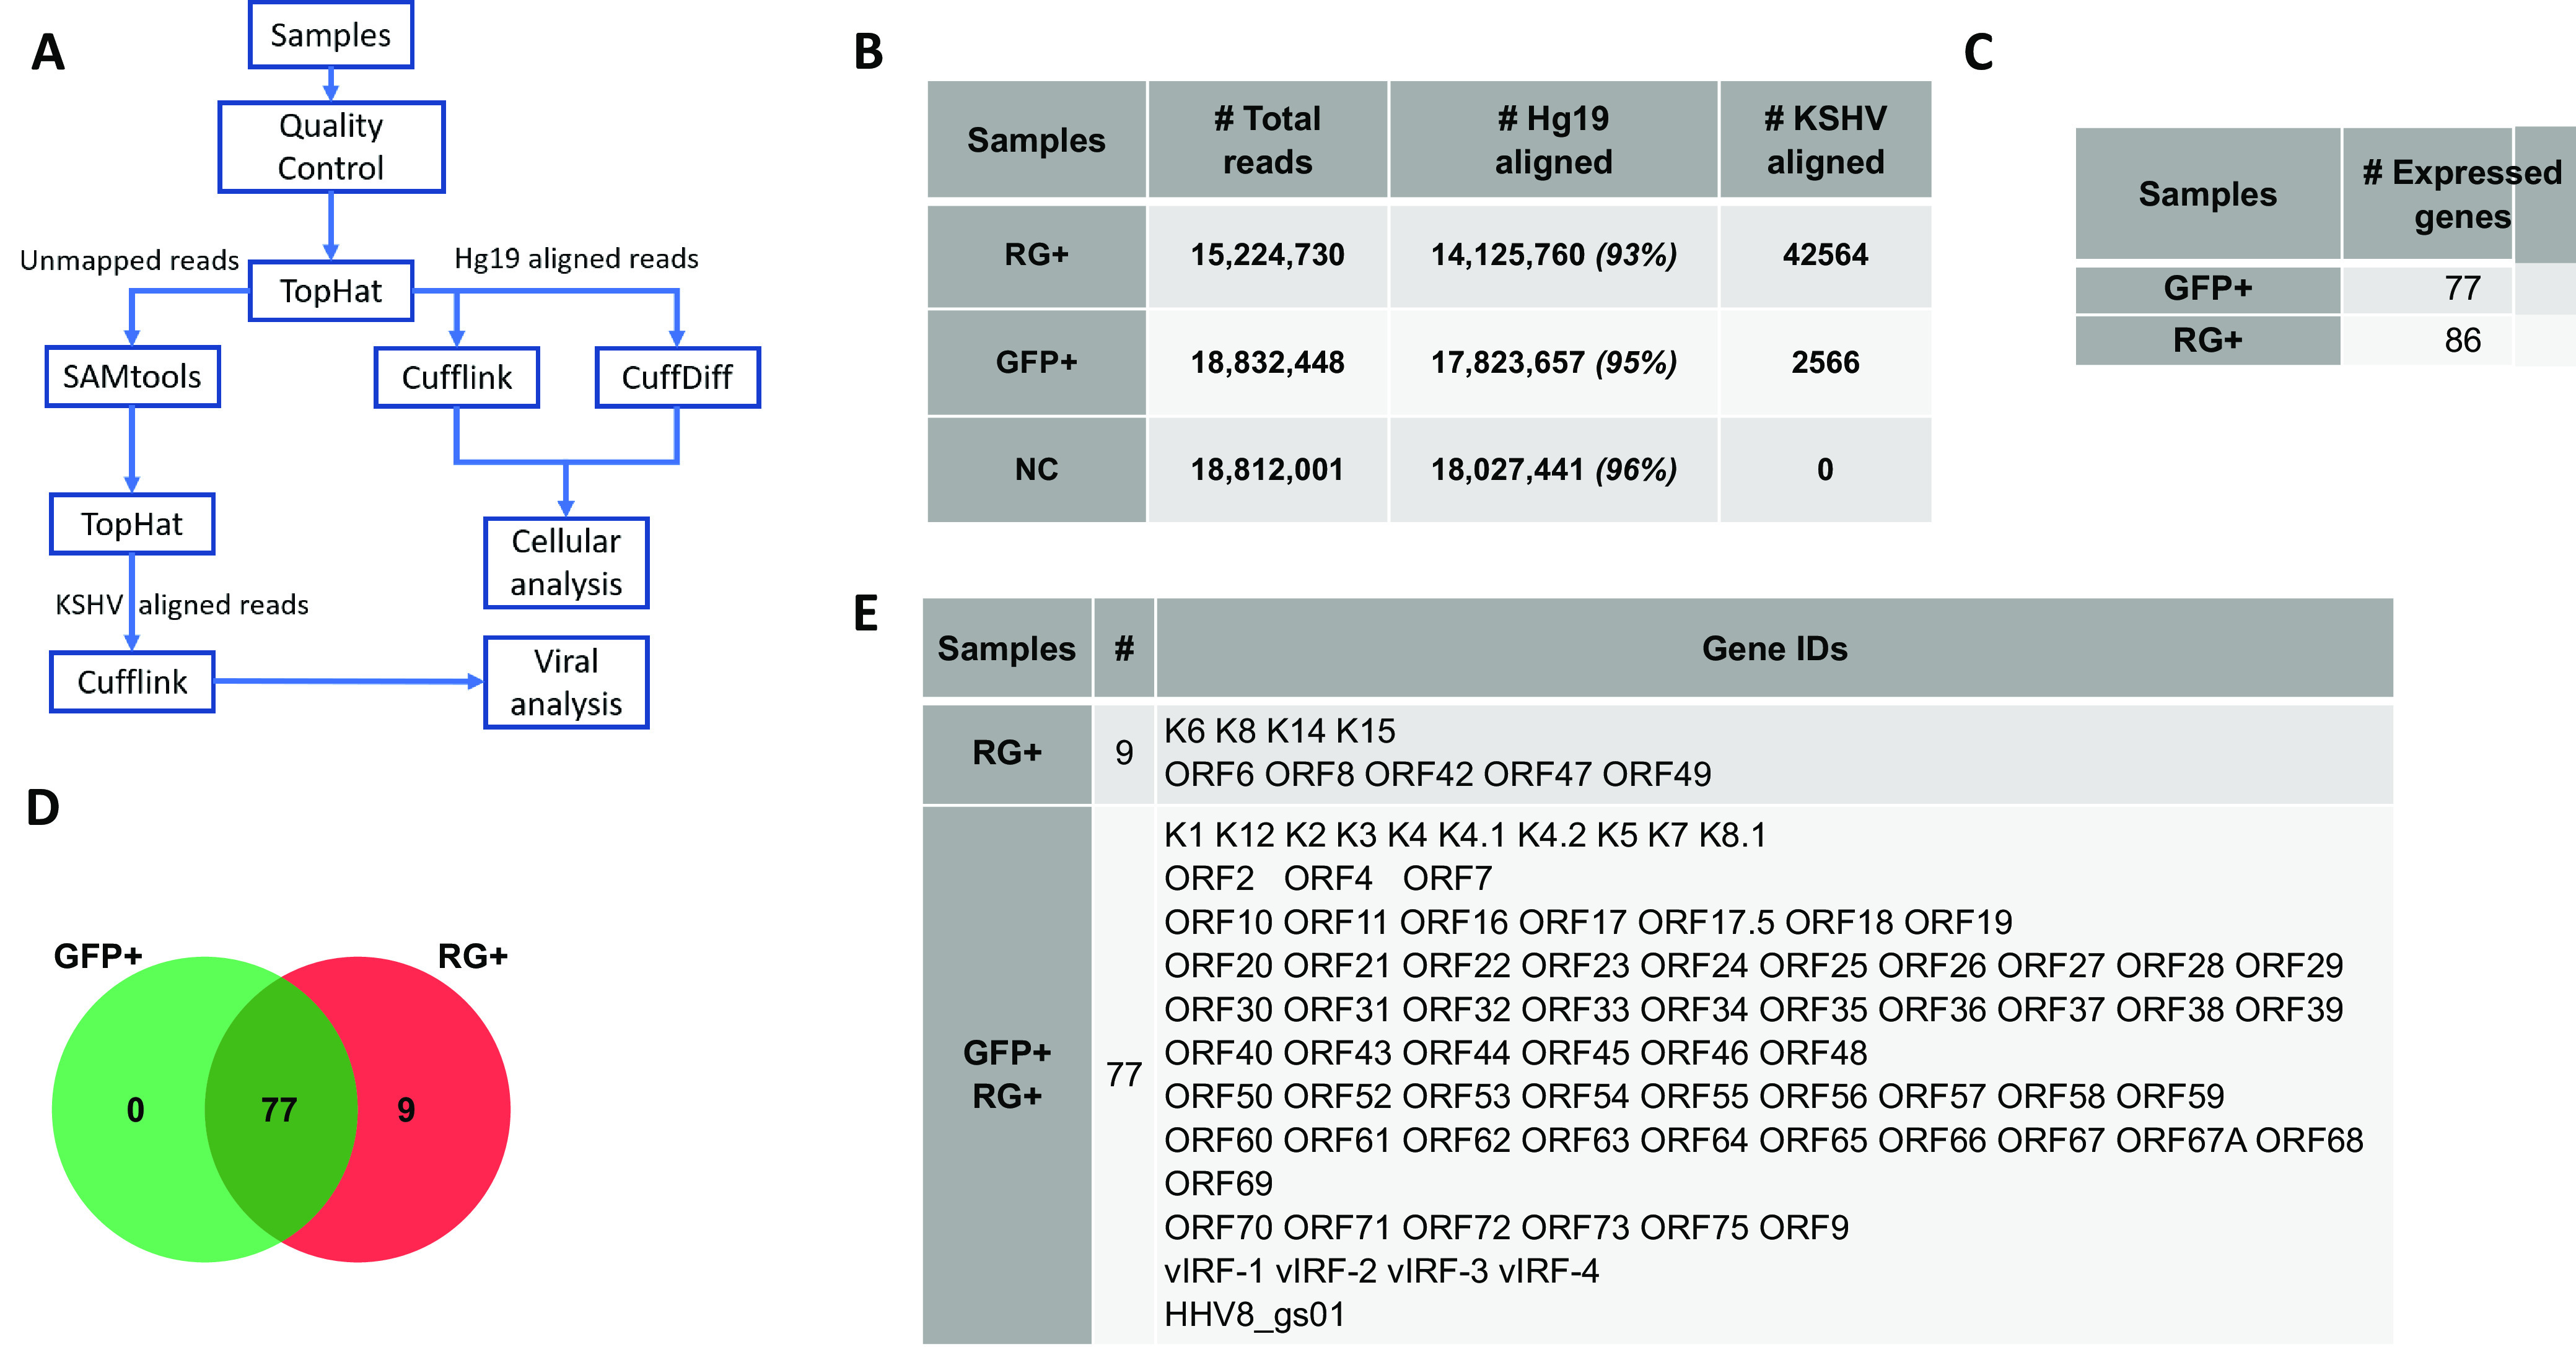
FIG 5.

Flowchart of RNAseq analysis and KSHV-expressed viral genes across two groups of rKSHV.219-infected GFP+ and RG+ cells. (A) Flowchart of RNAseq analysis. (B) Total reads from RNAseq across two groups of GFP+ SH-SY5Yand RG+ SH-SY5Y cells (hg19 was used as the reference alignment). (C) Number of viral genes expressed across the two groups of GFP+ and RG+ infected cell populations. (D) Venn diagram showing intersecting genes of the GFP+ and RG+ infected cell populations. (E) Viral genes associated with RG+ infected cells and overlapping genes between RG+ and GFP+ infected cell populations.
