
FIG 7.
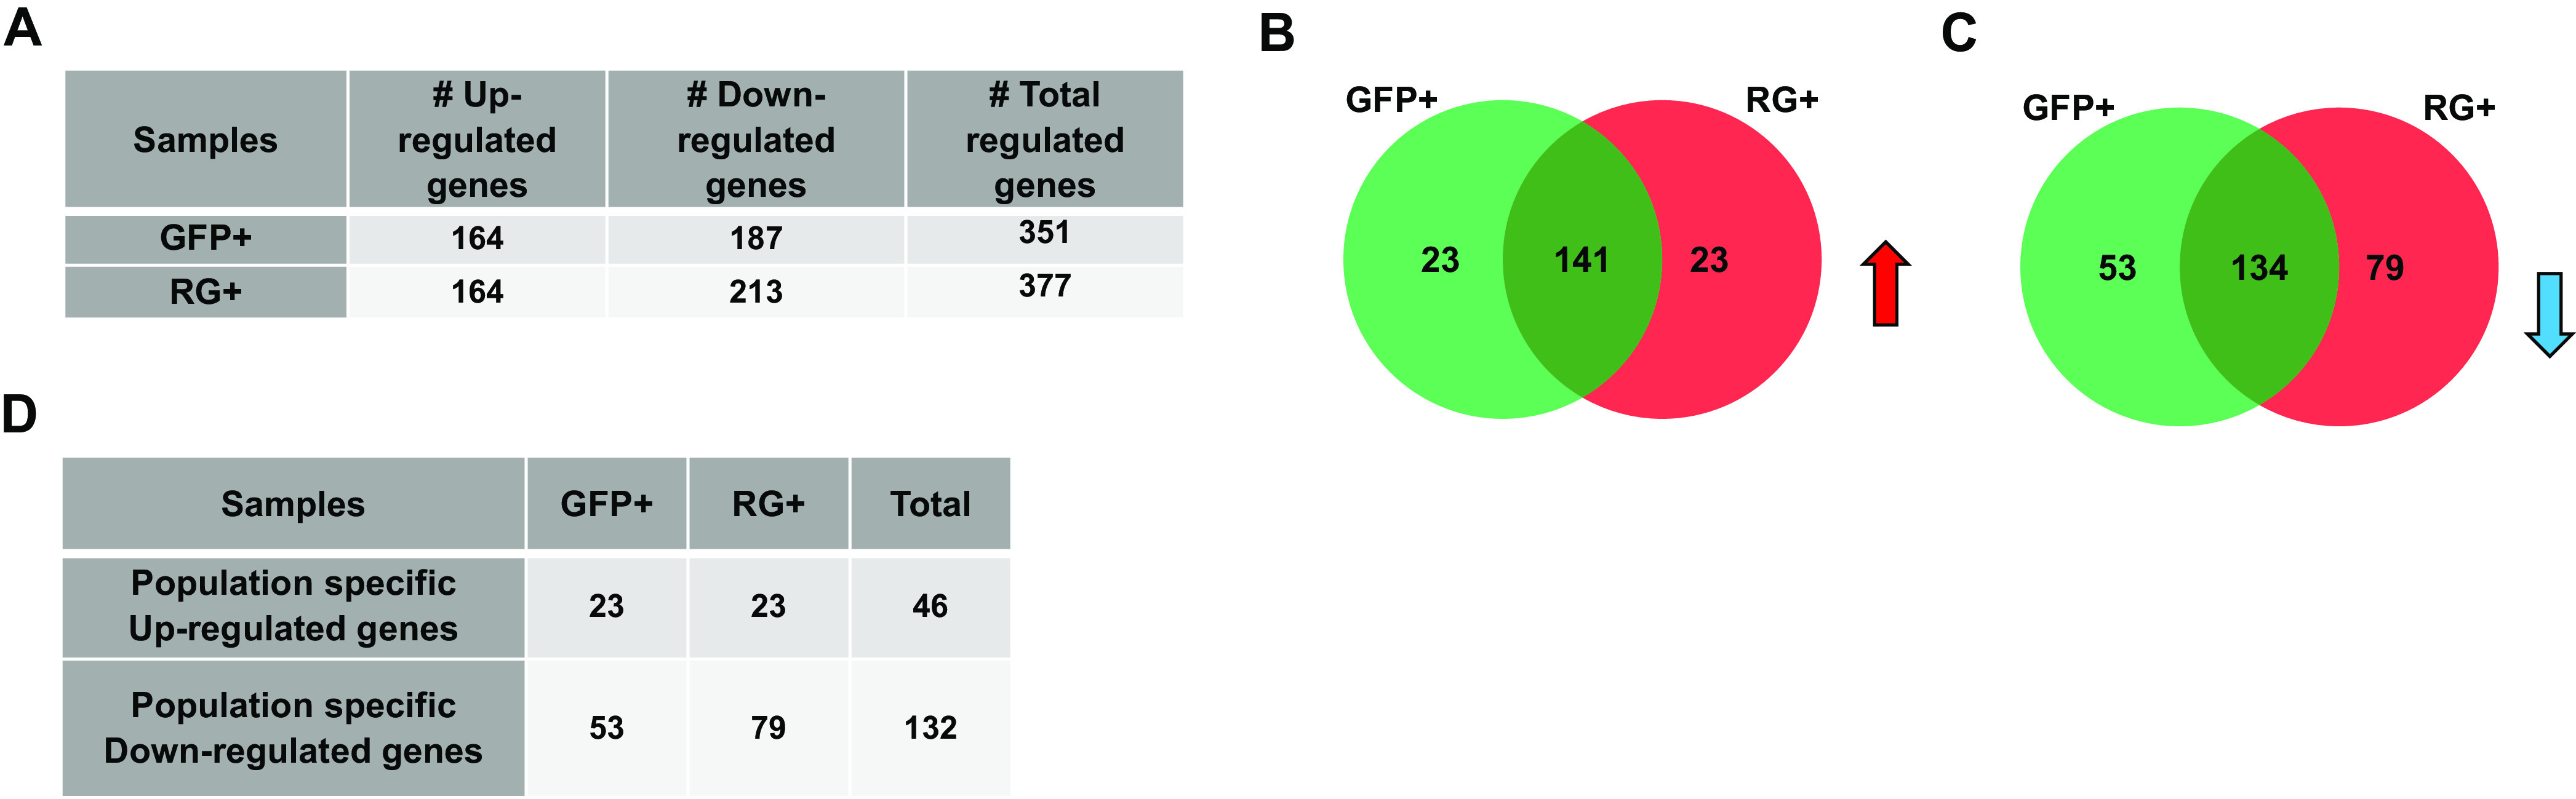
Significantly differentially expressed cellular genes across GFP+ and RG+ KSHV-infected cells. (A) Numbers of up-/downregulated genes across GFP+ and RG+ rKSHV.219-infected cells. (B) Venn diagram showing upregulated intersecting genes across two groups of GFP+ and RG+ infected cells (indicated by the red upward arrow). (C) Venn diagram showing downregulated intersecting genes across two groups of GFP+ and RG+ infected cells (indicated by the blue downward arrow). (D) Numbers of unique up-/downregulated genes associated with specific phenotypes of GFP+ and RG+ infected cells.