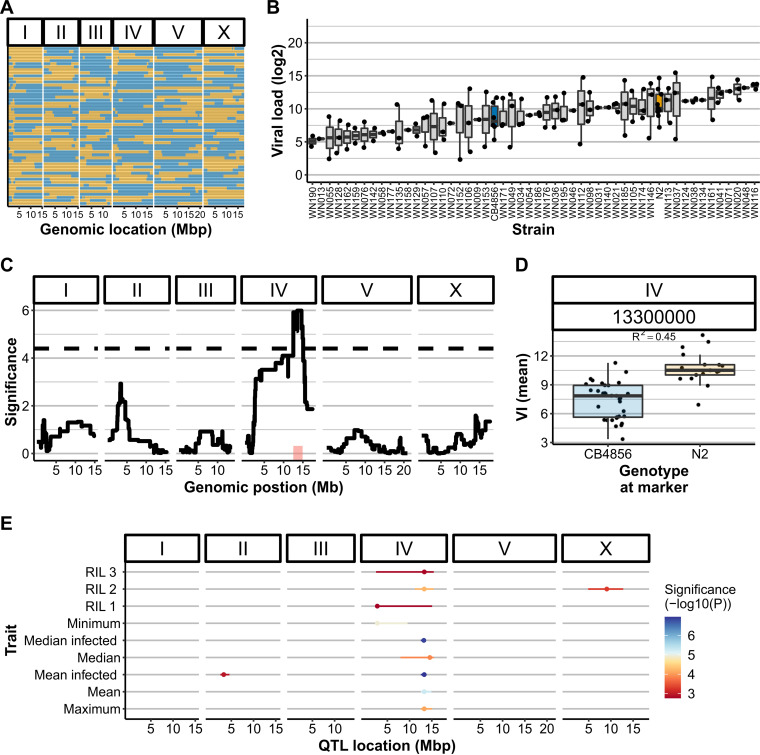
FIG 2.
OrV infections in a RIL panel with parental strains N2 (orange) and CB4856 (blue) and QTL mapping. (A) Genetic map of the N2xCB4856 RIL panel. (B) Transgression plot of the viral loads of 52 RIL strains used for the infection assays Each dot represents a biological replicate of a viral load measured after infection. All RIL strains were infected three times, but samples that lacked viral replication (viral load = 0) are not shown. (C) QTL profile for mean viral load (excluding unsuccessful infections). The confidence interval is indicated in red, and a QTL peak is found at the end of chromosome IV at 13.3 Mb. (D) Split-out of the genotypes at the QTL peak, explaining 0.45 of the trait variation (Pearson correlation). (E) Overview of QTL patterns with other statistical summaries. The dots denote the QTL peak and the lines indicate the confidence interval. Note that the overall threshold is –log10(p) = 4.4; hence, not all peaks shown here are significant. However, most link to the right side of chromosome IV.

