FIG 3.
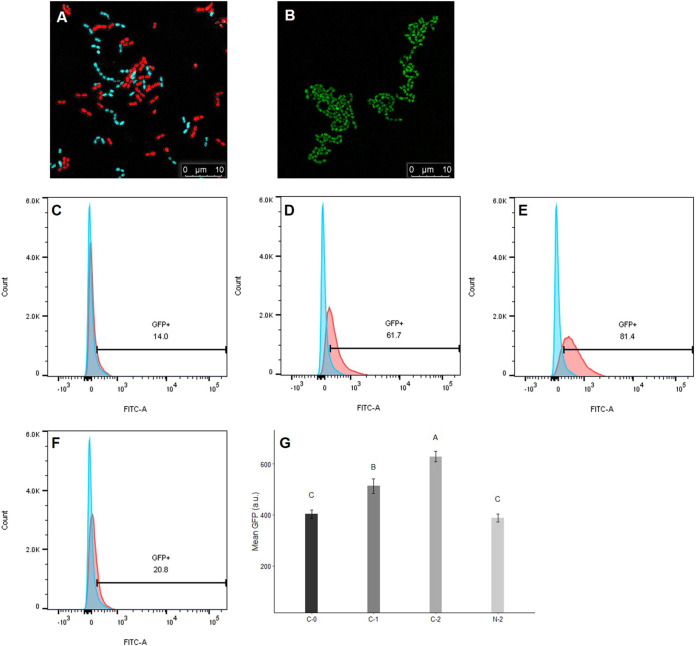
Influence of B. subtilis subsp. natto supernatant on the cCF10-inducible GFP reporter harbored on pCF10. (A) Under confocal microscopy, E. faecalis OG1Sp/pCF10-iGFP-p23-tdTomato (donor) appears red, and E. faecalis OG1RF::p23cfp (recipient) appears cyan. In the middle of the image, donor and recipient cells were close together, indicating that mating was likely happening. (B) When donor cells were induced with cCF10, they expressed the GFP reporter and exhibited green aggregates. (C to F) Donor cells were induced with 2.5 ng/ml cCF10 and harvested at 0, 60, and 120 min. Next, the expression of the GFP reporter was quantified using flow cytometry. Blue peak, wild-type E. faecalis OG1RF that would not express the GFP reporter, used as the negative control. Red peaks, donor cells induced with 0 ng/ml cCF10 for 0 min (C), 2.5 ng/ml cCF10 for 60 min (D), 2.5 ng/ml cCF10 for 120 min (E), or 2.5 ng/ml cCF10 plus B. subtilis subsp. natto SCS for 120 min (F). The numbers shown in the middle of panels C to F are the percentages of GFP-positive cells after gating. (G) Mean GFP intensity of GFP-positive donor cells after gating. Donor cells were induced with 0 ng/ml cCF10 for 0 min (C-0), 2.5 ng/ml cCF10 for 60 min (C-1), 2.5 ng/ml cCF10 for 120 min (C-2), or 2.5 ng/ml cCF10 plus B. subtilis subsp. natto SCS for 120 min (N-2). The data are presented as the means ± SDs (n = 3). Values with different uppercase letters were significantly different according to Duncan’s multiple-range tests (P < 0.05).

