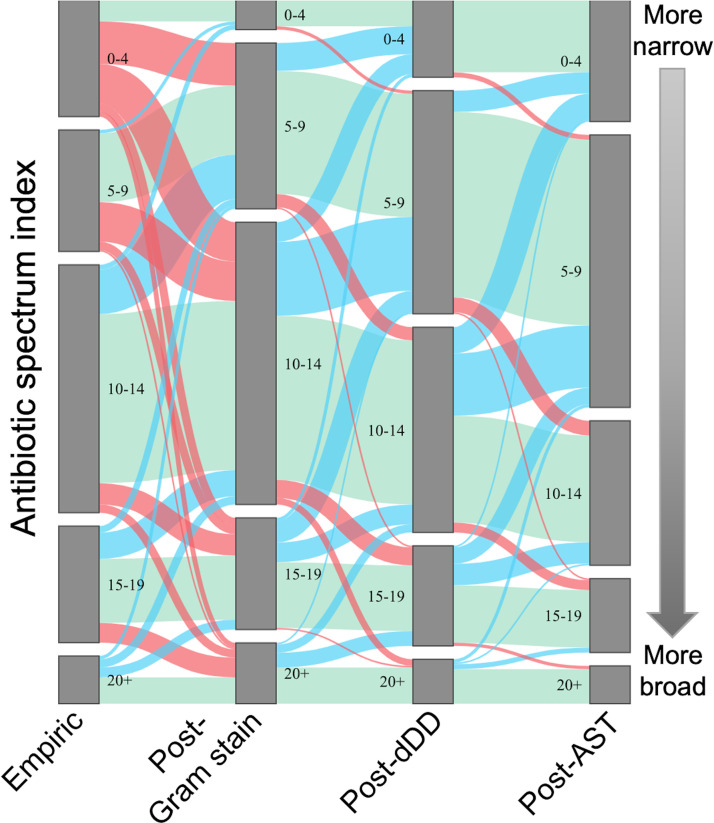
FIG 2.
Distribution of spectrum of antibiotics ordered to treat bacteremia in pediatric patients. Antibiotic spectrum, as measured by the antibiotic spectrum index (ASI), is represented in this Sankey diagram on the y axis. The height of each group indicates the proportion of patients with an aggregate antibiotic spectrum falling in that category at four time points. The ASI of empirical antibiotics was measured at the time of the Gram stain result to provide time for a treating physician to settle on an empirical regimen (labeled as Empiric). The post-Gram stain ASI was measured at the time of the dDD result (labeled as post-Gram stain). The ASI with the dDD result was measured at the time of the AST result (labeled as post-dDD). The ASI with the AST result was measured 24 h after the AST result was available (labeled as post-AST). Blue bands between the columns indicate the proportion of patients whose ASI decreased, green bands the proportion of patients whose ASI remained the same, and red bands the proportion whose ASI increased between two time points.

