
FIG 4.
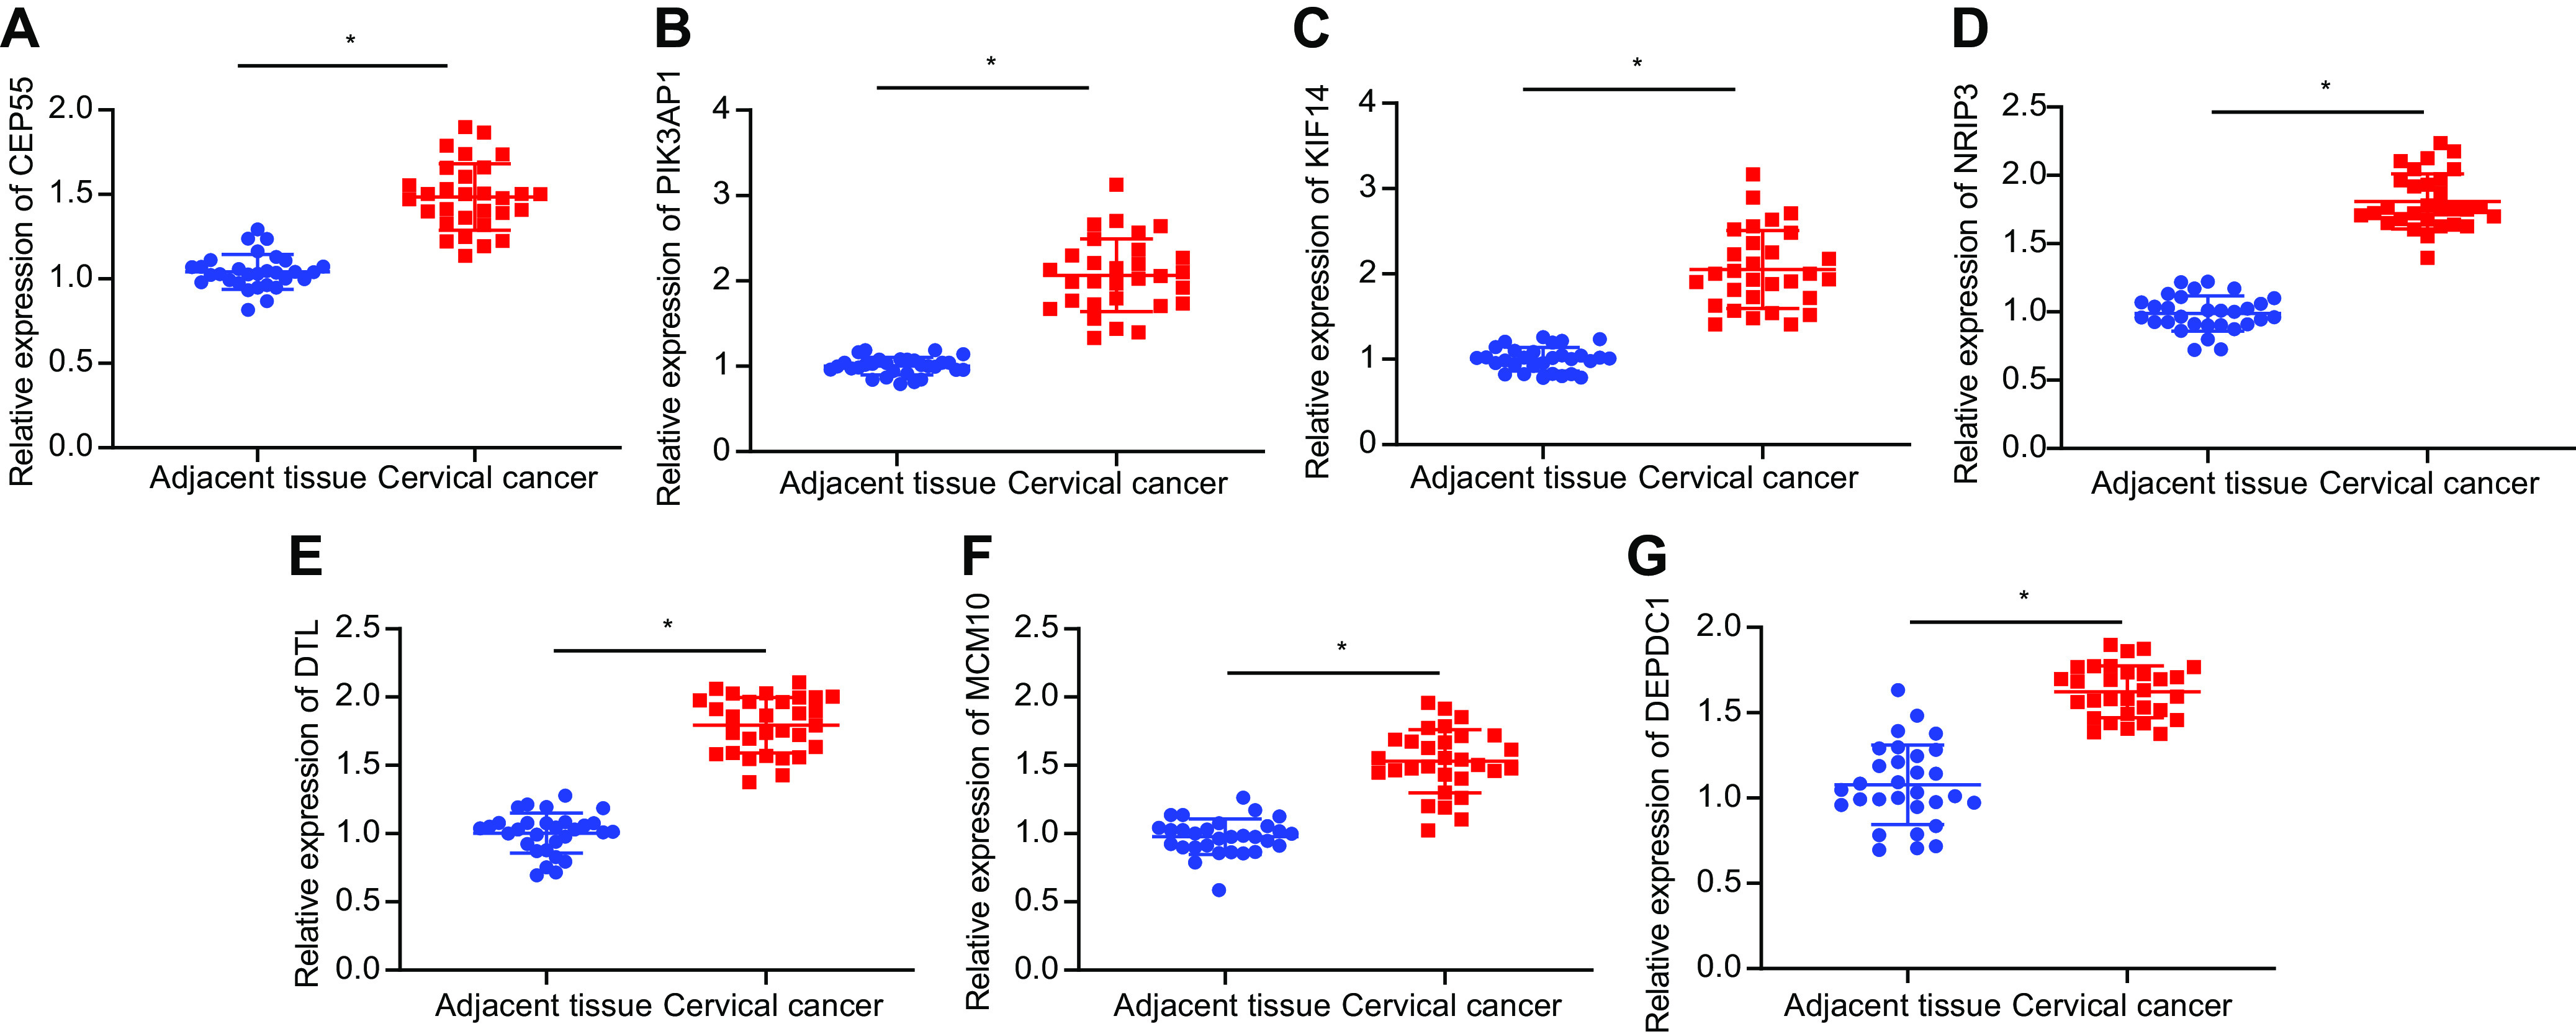
The mRNA expression of CEP55, PIK3AP1, KIF14, NRIP3, DTL, MCM10, and DEPDC1 in cervical cancer and adjacent tissues determined with RT-qPCR (n = 30). The measurement data are expressed as means ± standard deviations. ANOVA was used for the comparison among multiple groups, followed by Tukey’s post hoc test. *, P < 0.05 versus adjacent tissues.