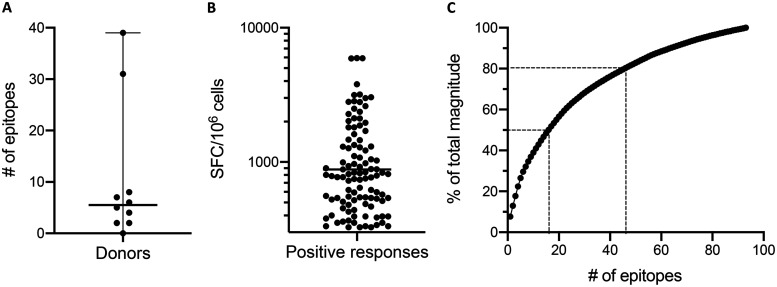
FIG 2.
Summary of epitopes and positive responses. (A) Number of epitopes detected per donor among the 10 donors included in the study. Black lines represent the median (5.5 epitopes) and range (0 to 39 epitopes). (B) The magnitude of all positive responses detected, shown as number of SFCs per 106 cells. The black line represents the geometric mean (882.1 SFCs/106 cells). (C) Percentage of the total response magnitude plotted as a function of the total number of epitopes. Epitopes are ranked in descending order of magnitude, and the percentage of the total magnitude was derived from the cumulative sum. Dotted lines represent the number of epitopes associated with 50% and 80% of the total response magnitude.

