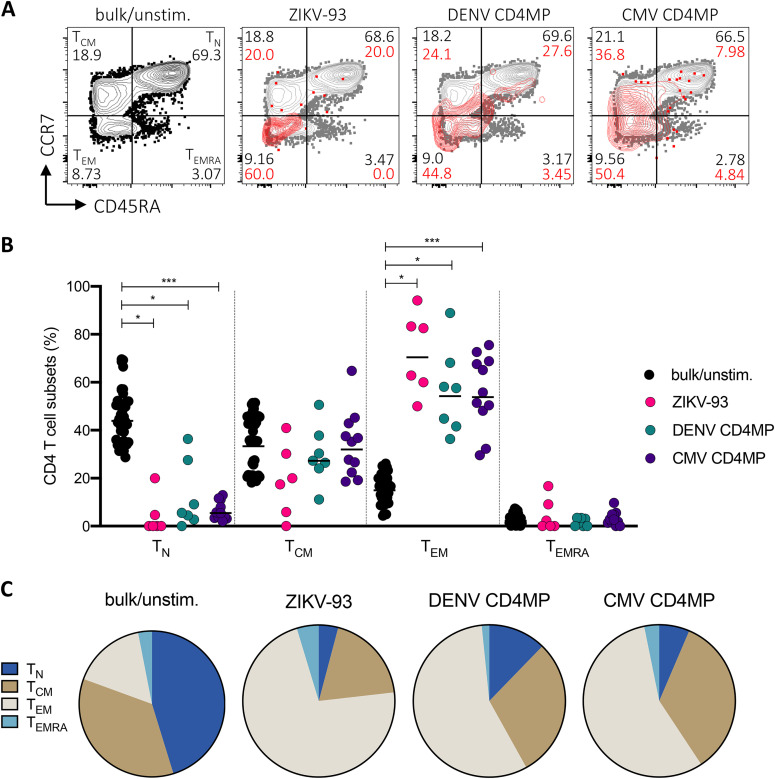
FIG 9.
Memory phenotypes associated with CD4 T cell responses. (A) Example of flow cytometry gating strategy for memory phenotypes of AIM+ and bulk CD4 T cells. Percentages of bulk CD4 T cells are shown in black, and percentages of AIM+ cells are shown in red. (B) Memory phenotypes of antigen-specific CD4 T cells (OX40+ CD137+ T cells) following ex vivo stimulation with peptide pools. CD4 responses are plotted if the percentage of AIM+ cells was >0.01. Black lines represent geometric mean, and pairwise comparisons between AIM+ cells in responding donors and bulk/unstimulated populations were performed using a Wilcoxon test. (C) Average memory phenotypes associated with AIM+ CD4 T cell responses in DENV-exposed subjects.

