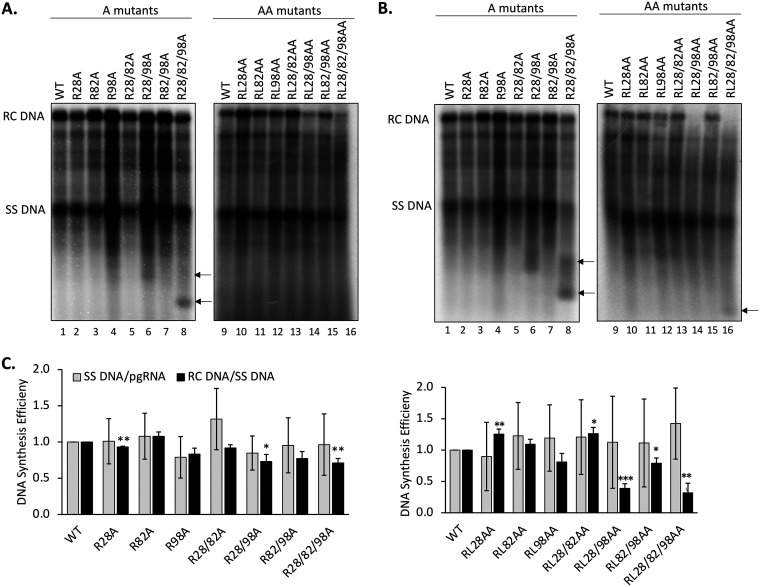
FIG 6.
Effects of the HBc CDM mutations on core DNA levels. HepG2 cells were transfected and harvested as described in the legend to Fig. 5. HBV NC-associated DNA (core DNA) was released from cytoplasmic lysate of transfected cells, without (A) or with (B) Turbo DNase pretreatment, by SDS-proteinase K digestion and analyzed by Southern blotting using an HBV DNA probe. Arrows indicate the short DNA fragments in lanes 6 and 8 in panel A and lanes 6, 8, and 16 in panel B, likely derived from incomplete DNA degradation. (C) The minus-strand (SS) DNA synthesis efficiency is represented by the relative levels of SS DNA normalized to those of the packaged pgRNA, and the SS DNA/pgRNA ratios are compared with that of the WT, which was set at 1.0. The plus-DNA strand synthesis efficiency was calculated by normalizing the relative levels of RC DNA to those of the SS DNA, and the RC DNA/SS RNA ratios were compared with that of the WT, which was set at 1.0. Data are presented as the mean and SD of results from three independent experiments. Asterisks indicate significant differences in comparison with the WT (*, P < 0.05; **, P < 0.01; ***, P < 0.001).

