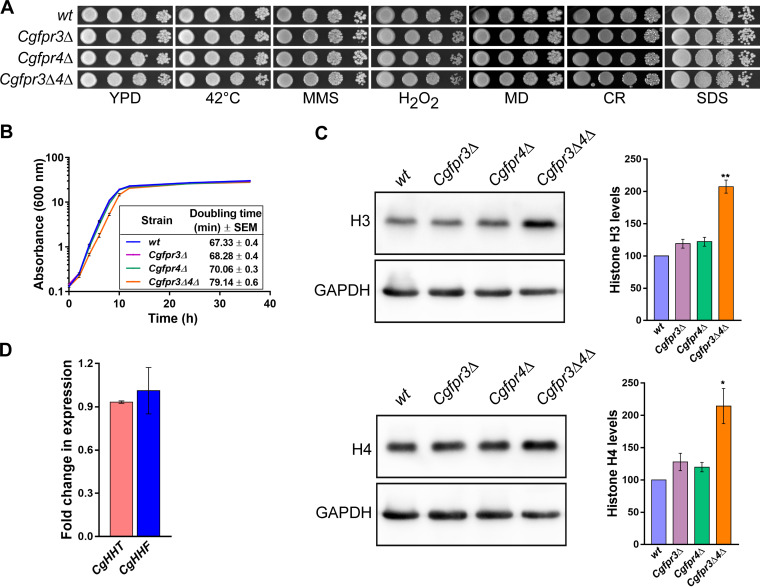
FIG 1.
The Cgfpr3Δ4Δ mutant contains elevated levels of histone H3 and H4 proteins. (A) Serial dilution spot analysis to assess the growth of the Cgfpr3Δ, Cgfpr4Δ, and Cgfpr3Δ4Δ mutants in the presence of different stressors. The indicated C. glabrata strains were grown overnight in YPD medium, and cultures were normalized to an OD600 of 1.0. Cultures were 10-fold serially diluted in PBS, and 3 μl of each dilution was spotted onto YPD medium lacking or containing the indicated compounds. Methyl methanesulfonate (MMS), hydrogen peroxide (H2O2), menadione (MD), Congo red (CR), and sodium dodecyl sulfate (SDS) were used at concentrations of 0.03%, 25 mM, 100 μM, 2 mg/ml, and 0.05%, respectively. All plates were incubated at 30°C unless indicated otherwise. Images were captured after 1 to 2 days of incubation. (B) Time course analysis of the wt, Cgfpr3Δ, Cgfpr4Δ, and Cgfpr3Δ4Δ strains. Cultures grown overnight in YPD medium were reinoculated into fresh YPD medium at an initial OD600 of 0.1 and incubated at 30°C. The absorbance of each culture was recorded at regular intervals until 36 h and plotted against time. Data represent means ± standard errors of the means (SEM) from 5 biological replicates. The growth period between 2 and 8 h, corresponding to the log phase of growth, was used to calculate the doubling time. Data represent means ± SEM from 5 biological replicates. Unpaired two-tailed Student’s t test was used to determine the statistical significance of doubling time differences between the wt and the Cgfpr3Δ4Δ mutant. ****, P ≤ 0.0001. (C) Representative immunoblots showing histone H3 and H4 levels in the indicated C. glabrata strains. Whole-cell extracts of log-phase cultures grown in YPD medium were prepared by the glass bead lysis method. Fifty micrograms of protein was resolved on a 15% SDS-PAGE gel and probed with anti-H3, anti-H4, and anti-GAPDH antibodies. CgGapdh was used as a loading control. For quantification, ImageJ densitometry software was used to measure the intensity of individual bands in 4 independent Western blots. The histone H3 and H4 signals were normalized to the corresponding CgGapdh signal. Data (means ± SEM; n = 4) represent percent changes in histone H3 and H4 levels in the CgfprΔ mutants compared to the wt strain (considered 100%) and are plotted as a bar graph on the right side of the blot images. *, P ≤ 0.05; **, P ≤ 0.01 (by paired two-tailed Student’s t test). (D) qPCR-based measurement of CgHHT (histone H3) and CgHHF (histone H4) transcript levels. Using the acid phenol method, total RNA was extracted from log-phase-grown wt and Cgfpr3Δ4Δ strains. Five hundred nanograms of the total RNA was used to set up real-time quantitative reverse transcriptase PCR. Transcript levels were quantified using the 2−ΔΔCT method. Data (means ± SEM; n = 3) were normalized against the CgTDH3 mRNA (which codes for GAPDH) control and represent fold changes in CgHHT and CgHHF expression in the Cgfpr3Δ4Δ mutant compared to the wt strain.

