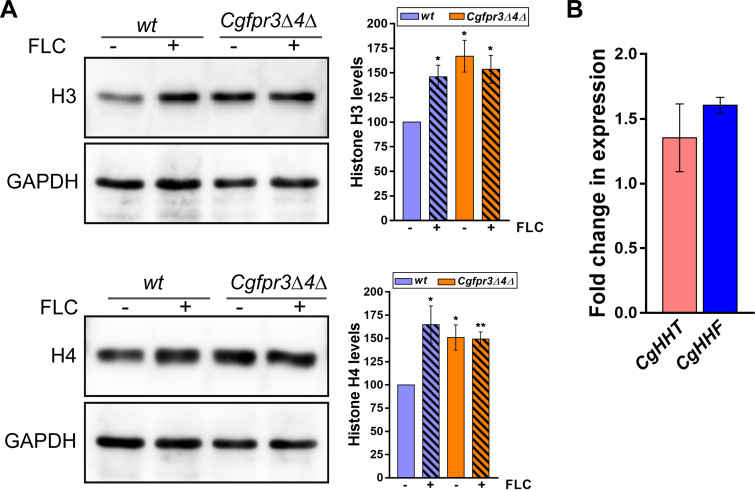
FIG 4.
Histone H3 and H4 protein levels are elevated upon fluconazole treatment. (A) Representative immunoblots showing histone H3 and H4 protein levels in fluconazole-treated wt and Cgfpr3Δ4Δ cells. Log-phase wt and Cgfpr3Δ4Δ cells were either treated with 16 μg/ml fluconazole for 4 h or left untreated. Whole-cell lysates were prepared by glass bead lysis, and 50 μg protein was resolved on 15% SDS-PAGE gels and probed with anti-H3, anti-H4, and anti-GAPDH antibodies. CgGapdh was used as a loading control. The intensity of individual bands from 4 to 5 independent Western blots was quantified using ImageJ densitometry software. H3 and H4 intensity signals were normalized to the corresponding CgGapdh signal. Data (means ± SEM; n = 4 to 5) represent the percent changes in histone levels in untreated Cgfpr3Δ4Δ and fluconazole (FLC)-treated wt and Cgfpr3Δ4Δ cells, compared to the untreated wt cells (considered 100%), and are plotted as a bar graph on the right side of the blot image. *, P ≤ 0.05; **, P ≤ 0.01 (by paired two-tailed Student’s t test). (B) qPCR-based analysis of CgHHT and CgHHF gene expression in wt cells upon fluconazole exposure. Log-phase wt cells were either left untreated or treated with 16 μg/ml fluconazole for 4 h. Total RNA (500 ng) was used to set up qPCR, and transcript levels were quantified using the 2−ΔΔCT method. Data (means ± SEM; n = 3) were normalized against the CgTDH3 mRNA control and represent fold changes in CgHHT and CgHHF expression in fluconazole-treated wt cells compared to untreated wt cells (taken as 1.0).

