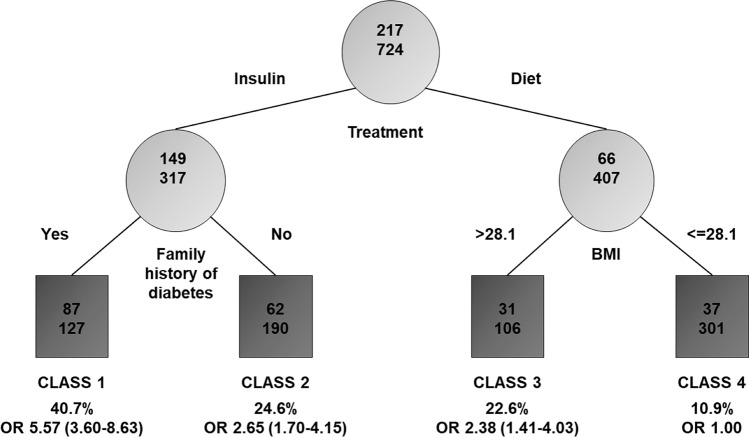
Fig. 2.
Results of the RECPAM analysis: identification of subgroups at different risks of developing postpartum dysglycemia. The tree-growing algorithm modeled odds ratios (ORs) following a logistic regression model with age, education, occupation, ethnicity, previous GDM, pre-pregnancy BMI, family history of diabetes, first pregnancy, physical activity before pregnancy, smoke, treatment, total cholesterol, HDL, LDL, triglycerides, systolic blood pressure, diastolic blood pressure and composite of adverse neonatal outcomes as covariates. Splitting variables are shown between branches, whereas the condition sending patients to the left or right sibling is on the relative branch. Circles indicate subgroups of patients, squares indicate the final RECPAM classes. Numbers inside circles and squares represent the number of events (top) and the number of nonevents (bottom), respectively. An OR with the corresponding 95% CI (in parentheses) is shown for each class. Class 4, with the lowest risk of developing dysglycemia, is placed at the extreme right and is the reference category (OR = 1)

