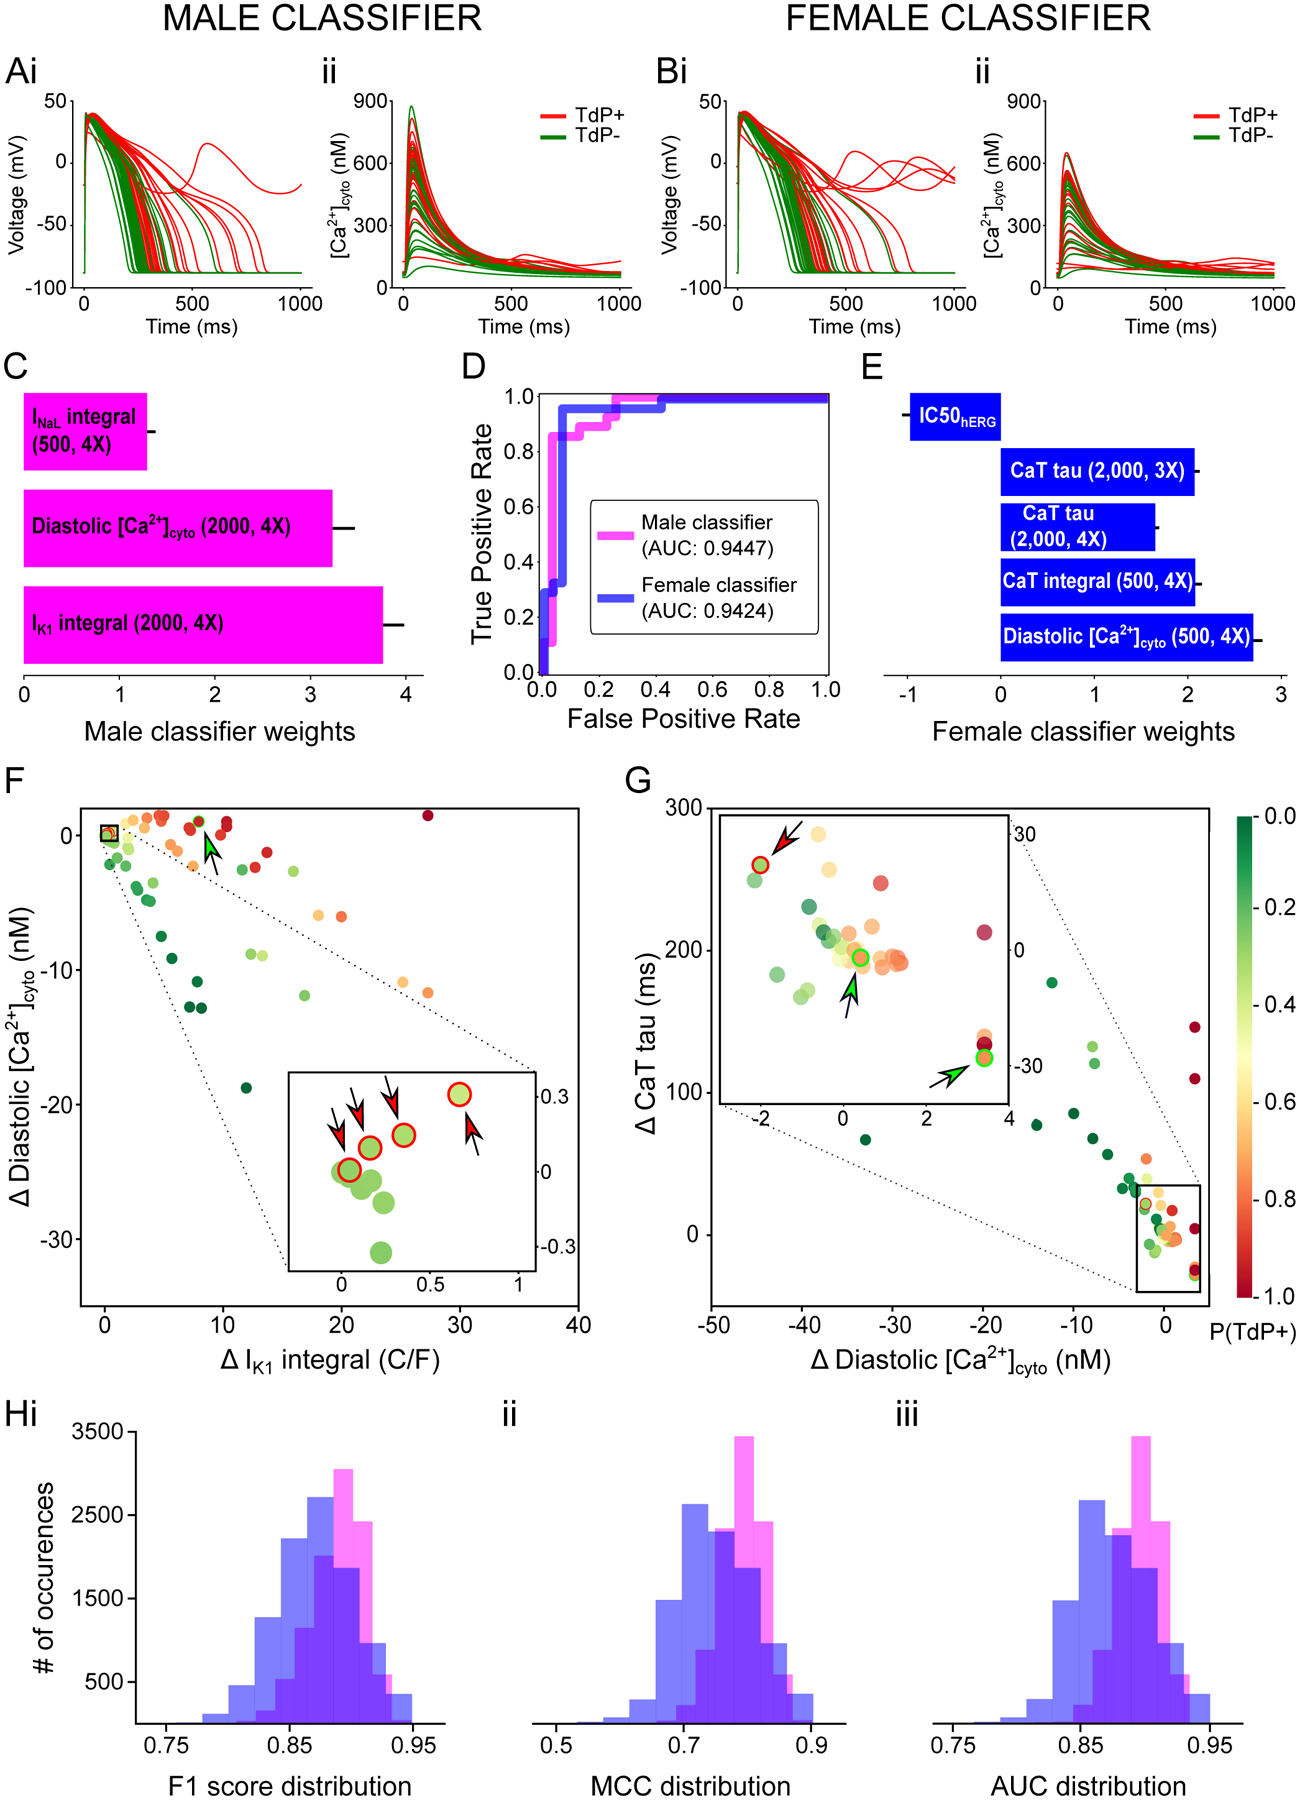
Figure 3: Sex-specific TdP risk classifiers.

A,B: simulated effects of the 59 training drugs on the AP (i) and CaT (ii) with male (A) and female (B) biophysical myocyte models paced at a BCL of 1,000 ms. Traces belonging to drugs TdP+ and TdP− are colored in red and green, respectively. C,E: best performing set of features selected through RFE and used to build the male (C) and female (E) TdP classifiers. Uncertainty of the feature weights is measured using LOO-CV (mean + SD). D: Receiver operating characteristic curve for male (magenta) and female (blue) TdP classifiers. Area under the curve (AUC) is 0.9447 and 0.9424 for male and female, respectively. F,G: scatterplot of the training drugs created using the two features with the largest weight for the male (F) and female (G) TdP classifiers. The estimated TdP risk probability for each drug is indicated by the color of the filling. The misclassified drugs are indicated by arrows, and the color of the arrow and the stroke specifies the right class (green for TdP−, red for TdP+). H: distributions of performance metrics for the male (magenta) and female (blue) TdP classifiers after injecting random normally-distributed (μ=0, σ=0.1) noise to the original data (10,000 repetitions).
