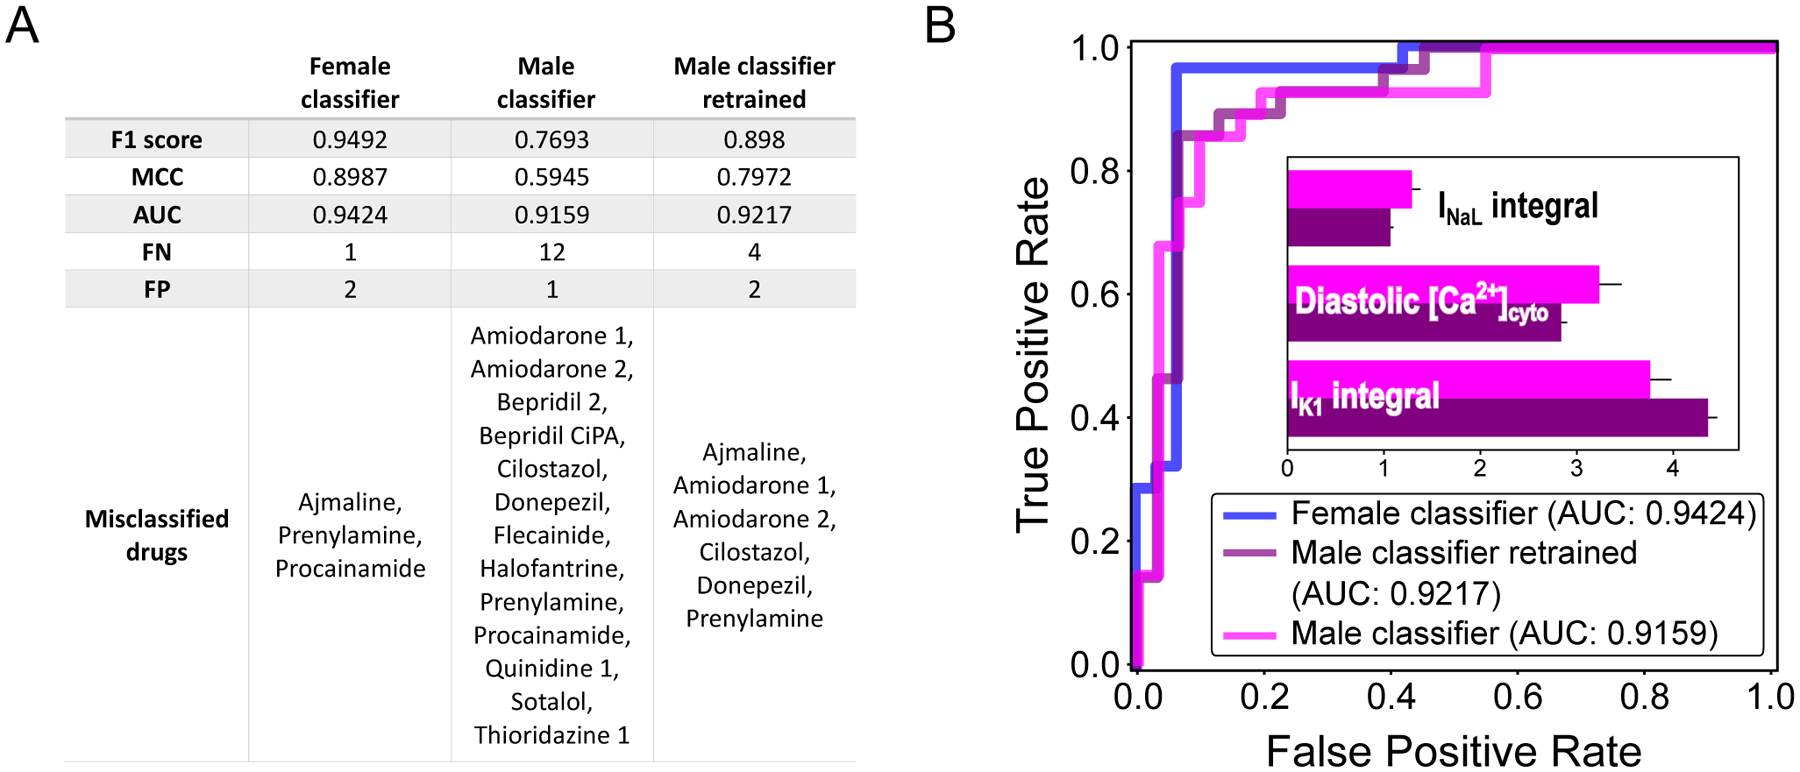
Figure 4: Predictions of TdP risk on female data with male-specific features.

A: TdP classifier performances are evaluated on the dataset created with the female biophysical model. The results obtained with the female classifier (left column) are compared with the ones of the original male classifier (center column) and of a male classifier retrained on the female dataset (right column). B: Receiver operating characteristic curve for female (blue), original male (blue), and retrained male (purple) TdP classifiers applied on female data; area under the curve (AUC) is 0.9424, 0.9159, and 0.9217, respectively. In the inset, bar plot comparing the weights of the original (magenta) and retrained (purple) male classifiers. Uncertainty of the feature weights is measured using LOO-CV (mean + SD).
