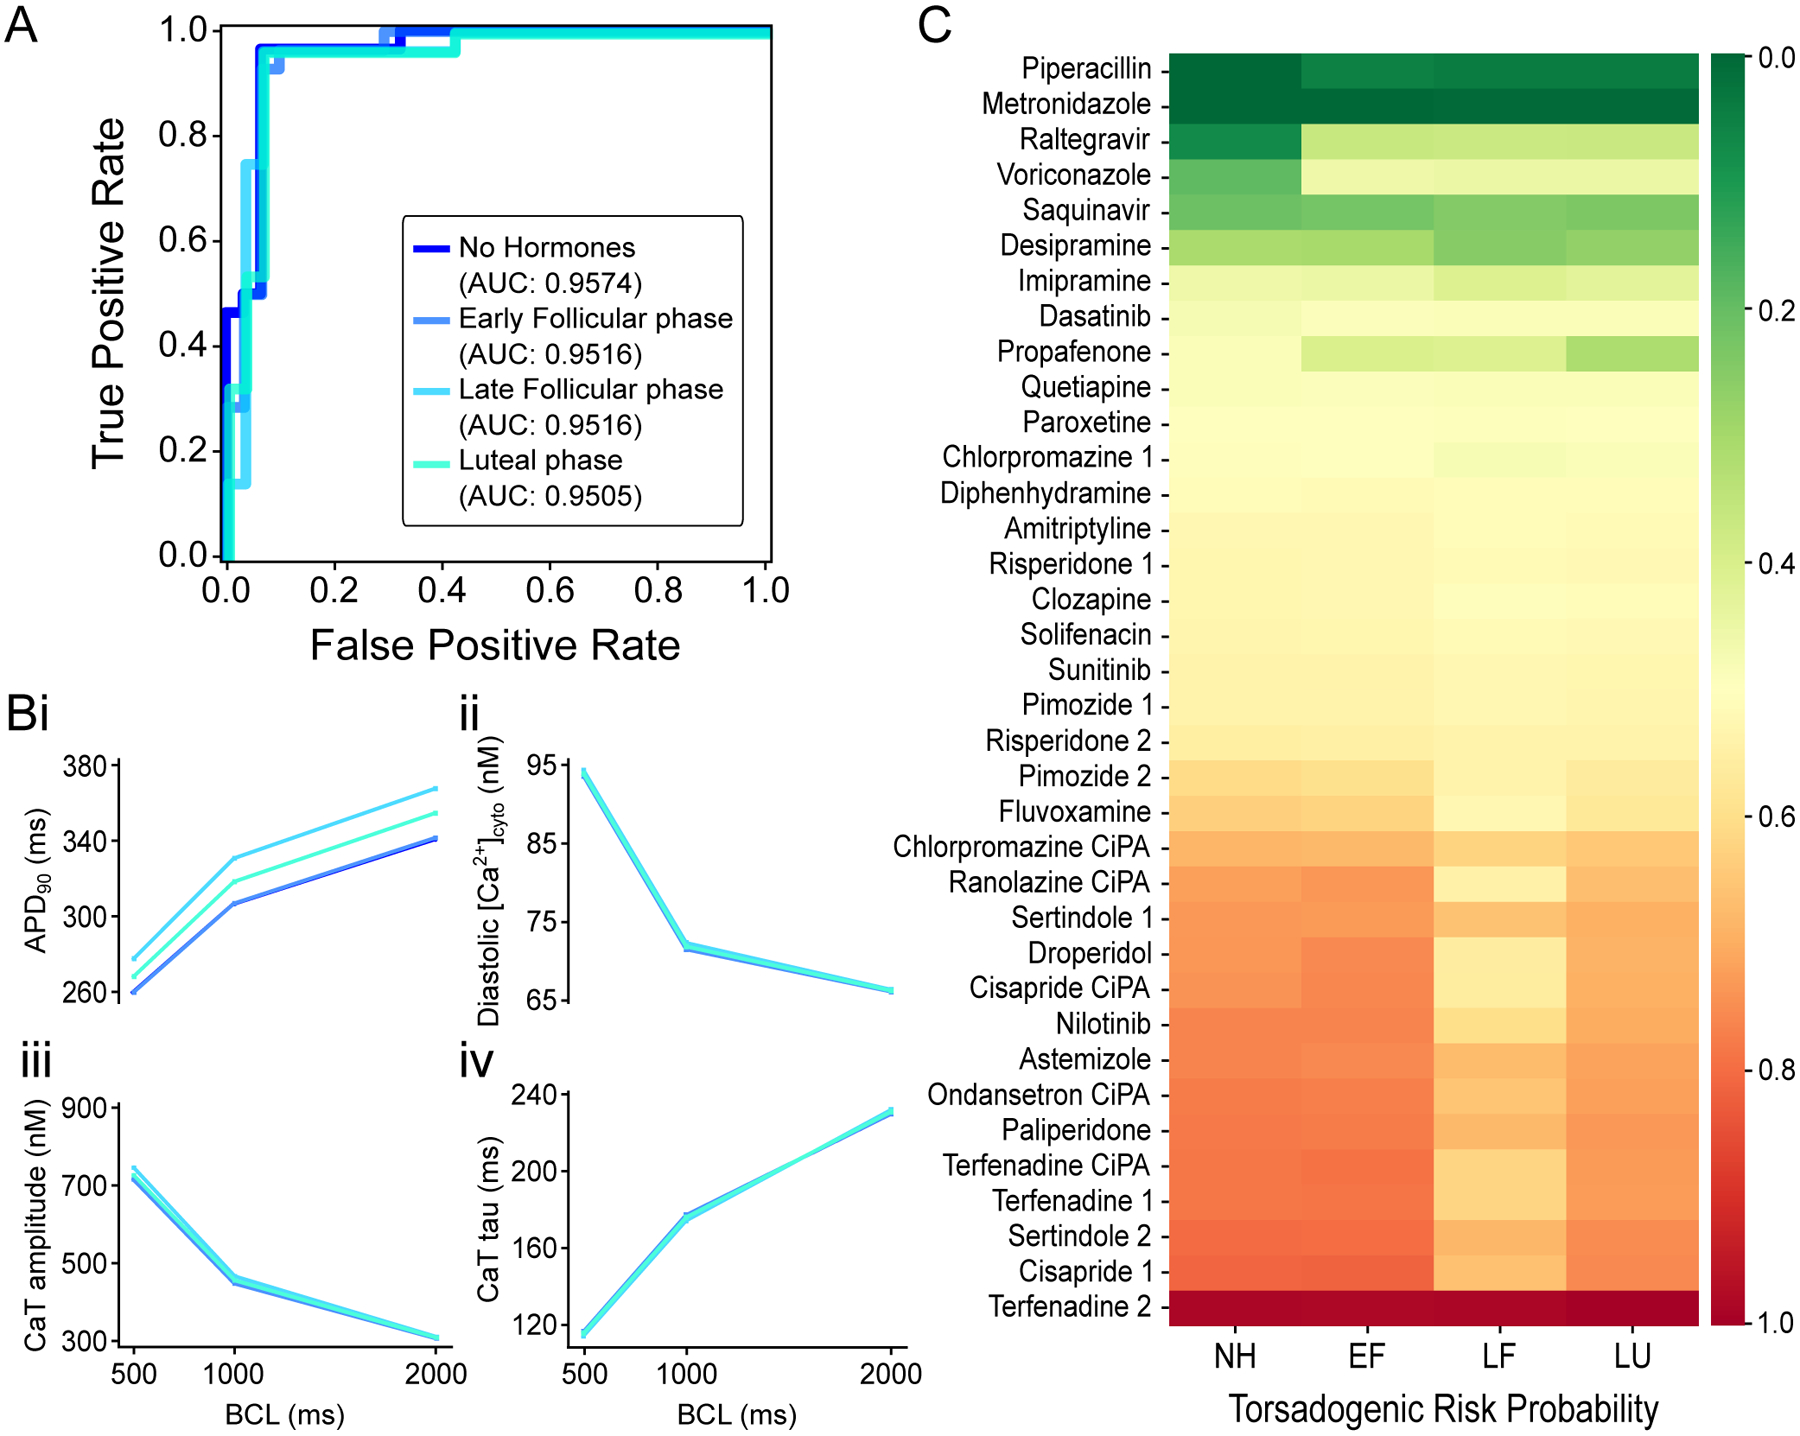
Figure 6: Effects of sex hormone fluctuations on female TdP classifier predictions.

A: Receiver operating characteristic curve for female TdP classifier applied on training drugs dataset in absence of hormonal effects (navy blue) or simulating early follicular (EF, azure blue), late follicular (LF, sky blue), and luteal (LU, turquoise) phases. Area under the curve (AUC) is 0.9574, 0.9516, 0.9516, and 0.9505, respectively. B: Rate dependency of biomarkers simulated during different menstrual phases: measurements of voltage- (i) and Ca2+-related (ii-iv) biomarkers as a function of the BCL tested. C: heatmap of the predicted torsadogenic risk probabilities of intermediate TdP risk drugs simulated during different menstrual phases.
