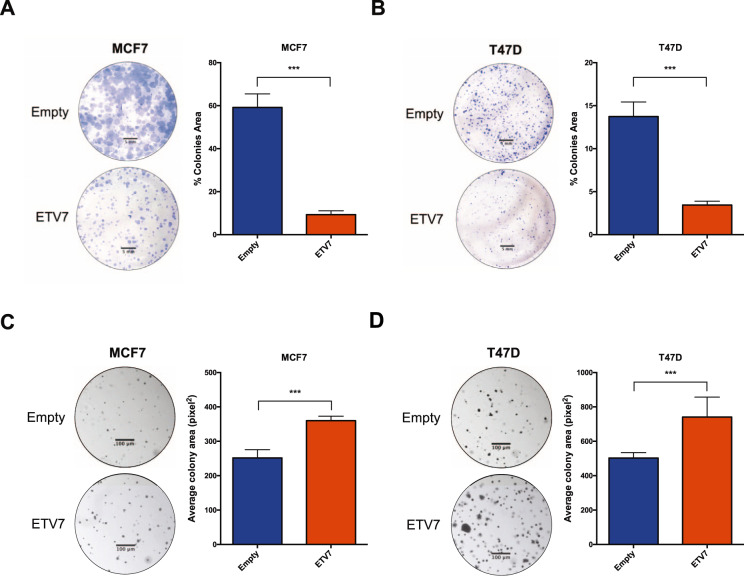
Fig. 2. Breast cancer-derived cells over-expressing ETV7 display altered proliferative potential.
A, B Colony formation/clonogenic assay of MCF7 (A) and T47D (B) Empty and ETV7 cells after 3 weeks of growth. Presented are a representative image (left) of the entire well and the total colony area (right), calculated with the ImageJ software. C, D Soft agar colony formation assay of MCF7 (C) and T47D (D) Empty and ETV7 cells after 3 weeks of growth. On the left, a representative image of part of the well (taken at ×5 magnification) and on the right the average colony area calculated with the ImageJ software. Indicated are the scale bars for microscopy images. Bars represent the averages and standard deviations of at least three independent experiments. ***p-value < 0.001.

