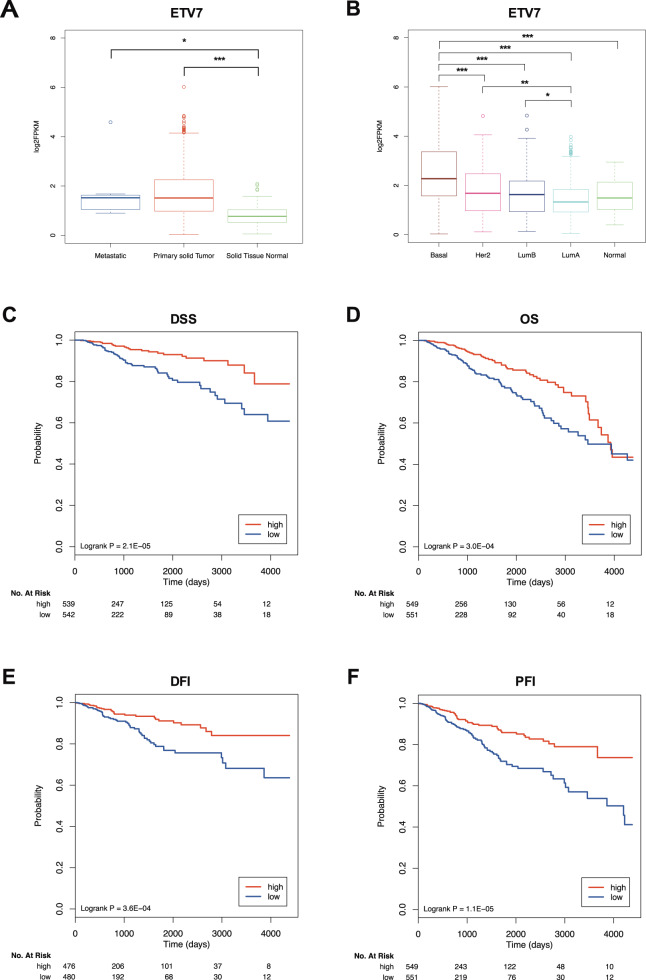
Fig. 6. The expression of ETV7 and ETV7-repressed interferon signature genes have prognostic value in breast cancer.
A, B ETV7 expression in TCGA BRCA samples classified by tissue type (A) and PAM50 molecular subtype (B). Plot whiskers extend to the most extreme data point which is no more than 1.5 times the interquartile range from the box. The significance is calculated with ANOVA and post-hoc Tukey test. *p-value < 0.05; ***p-value < 0.001. C–F Kaplan–Meier curves for TCGA breast cancer patients stratified according to the average expression of ETV7-regulated IFN-responsive gene signature. Curves represent the probability of disease-specific survival (DSS) (C), overall survival (OS) (D), disease-free interval (DSI) (E) and progression-free interval (PFI) (F). p-values are calculated with logrank test.

