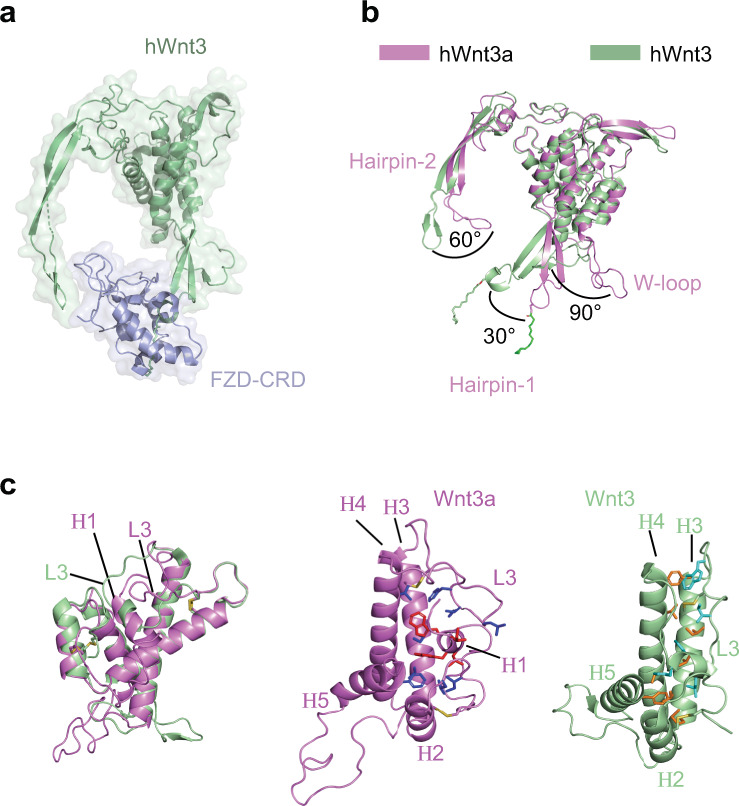
Fig. 4. Comparison between WLS bound Wnt3a and FZD-CRD bound Wnt3.

a Structure of hWnt3 in complex with FZD-CRD42. b Superimposition of hWnt3a and hWnt3. c Comparison of N-terminal regions of Wnt3a and Wnt3. In left panel, N-half regions are isolated from superimposition result of Wnt3a and Wnt3. In right panel: For Wnt3a, residues of H1 are colored in red and shown as sticks, and interacting residues are colored in blue. For Wnt3, residues of L3 are colored in cyan and shown as sticks, and interacting residues are colored in orange. Disulfide bonds are shown as sticks.
