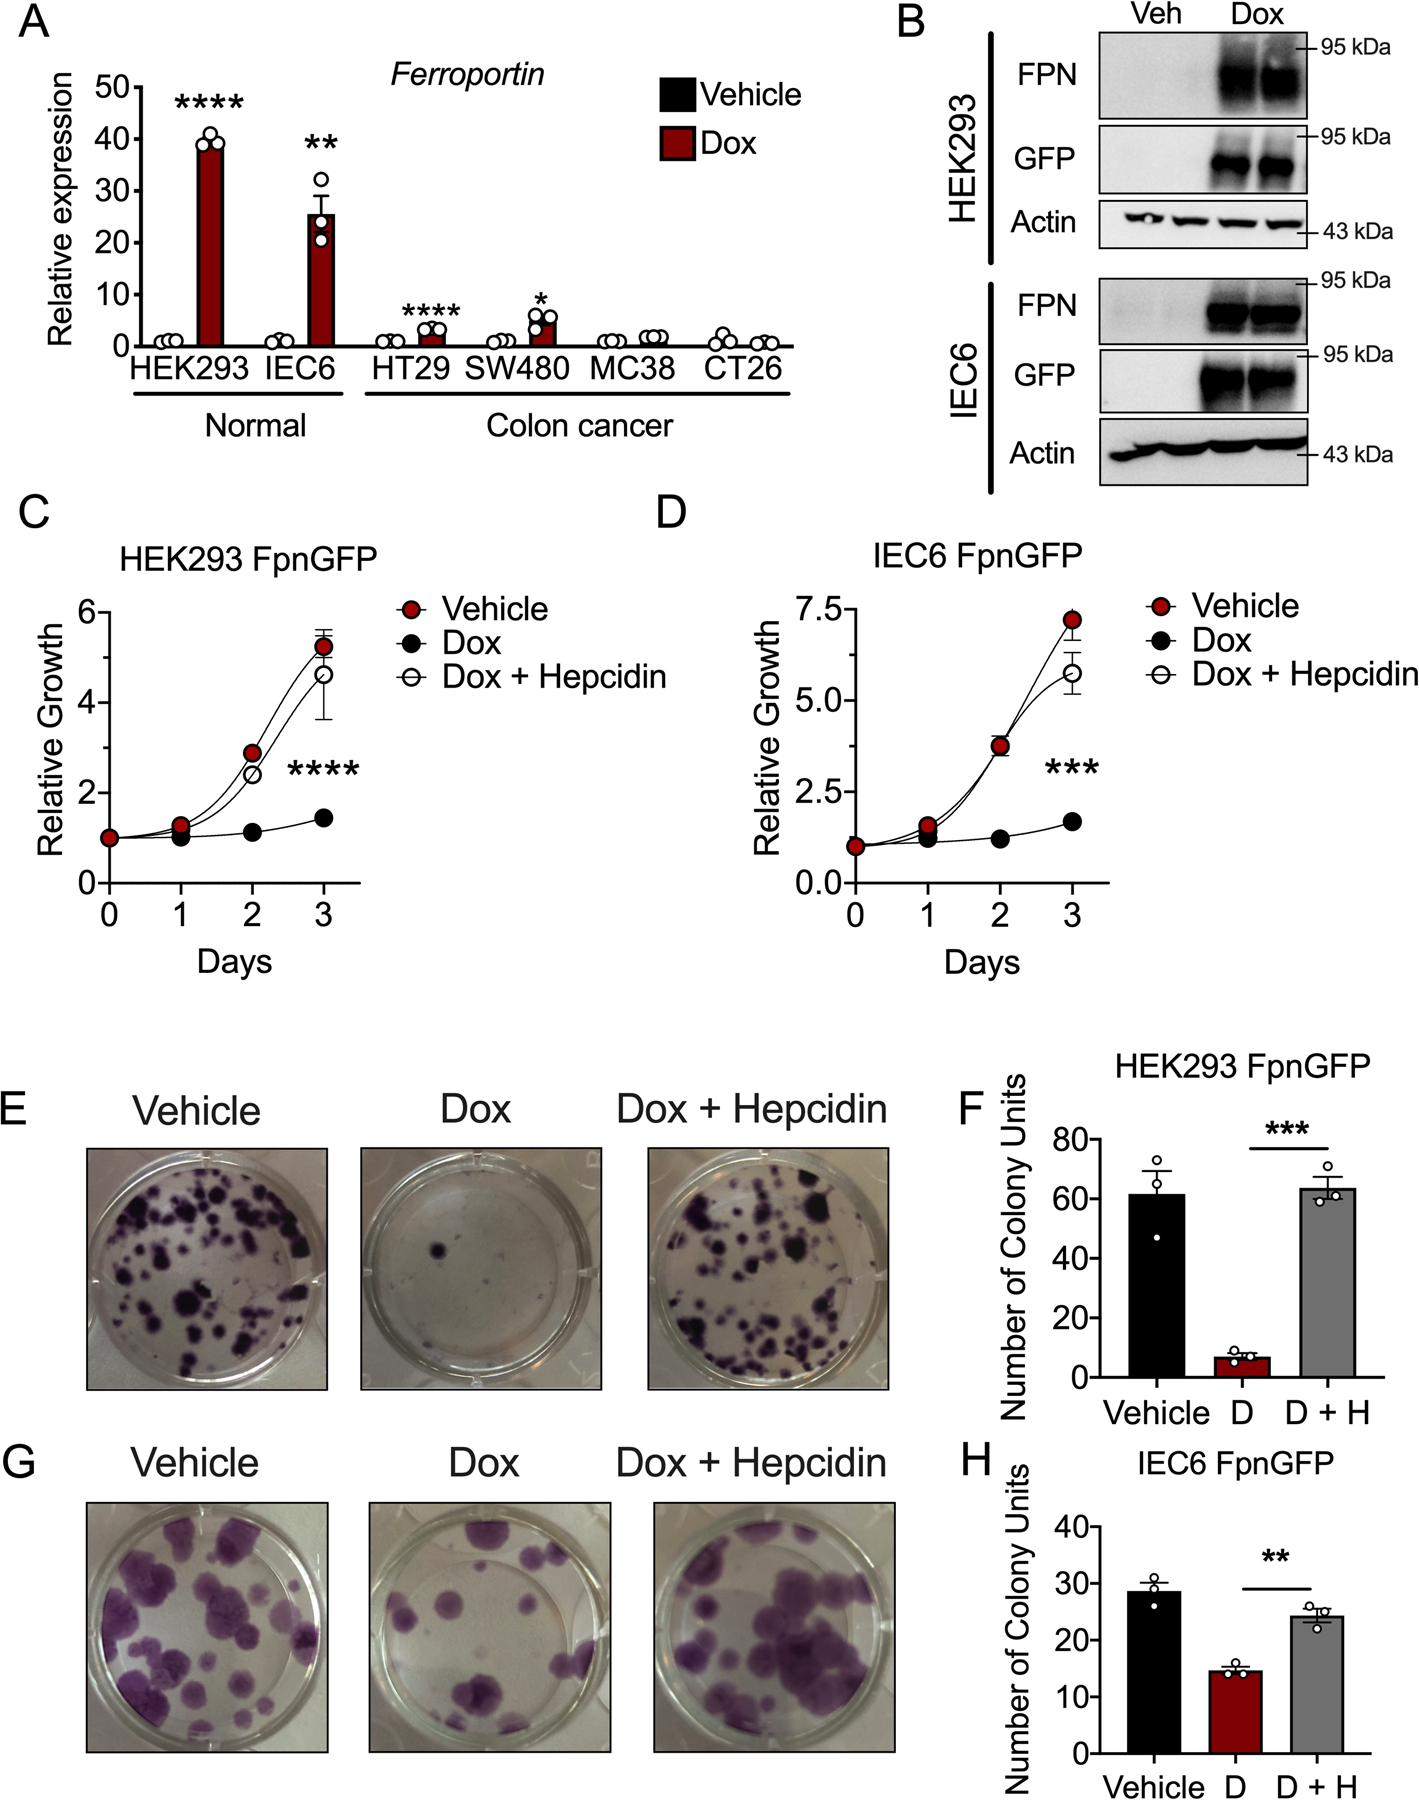
Extended Figure 4. Colon cancer-derived cell lines are exquisitely sensitive to ferroportin-mediated iron loss.

(A) qPCR analysis for the ferroportin transcript in late passages of cells that were made stable for a doxycycline (dox) inducible ferroportinGFP overexpression construct, following 16 hour treatment with dox (250 ng/mL) (N=3 biologically independent cell replicates for each cell line and treatment, HEK293 p=.0001, IEC6 p=0.0021, HT29 p<0.0001, SW480 p=0.0103) (B) Western blot analysis for GFP and ferroportin (FPN) in stable, normal ferroportinGFP overexpressing cell lines following 16 hour treatment with dox (250 ng/mL). (C and D) Cell growth MTT assay in HEK293 ferroportinGFP (C) (N=3 biologically independent cell replicates for each cell line, treatment, and time point, p<0.0001) and (D) IEC6 ferroportinGFP cells (N=3 biologically independent cell replicates for each cell line, treatment, and time point, p=0.0008) treated with vehicle, dox (250 ng/mL), or dox (250 ng/mL) and recombinant hepcidin (1 μg/mL) (E-H) Representative crystal violet staining images (E) and quantification (F) of HEK293 ferroportinGFP (N=3 biologically independent cell replicates for each cell line and treatment, p=0.0005) and IEC6 ferroportinGFP cells, images (G) and quantitation (H) (N=3 biologically independent cell replicates for each cell line and treatment, p=0.0025) ten days following treatment with vehicle, dox (250 ng/mL), or dox (250 ng/mL) and recombinant hepcidin (1 μg/mL) Data represent the mean ± SEM. Significance was determined by 2- tailed, unpaired t test (A) or by 1-way ANOVA with Tukey’s post hoc (C,D,F,H). *P < 0.05, **P < 0.01, ***P < 0.001, and ****P < 0.0001 comparing within each cell line or across treatment groups.
