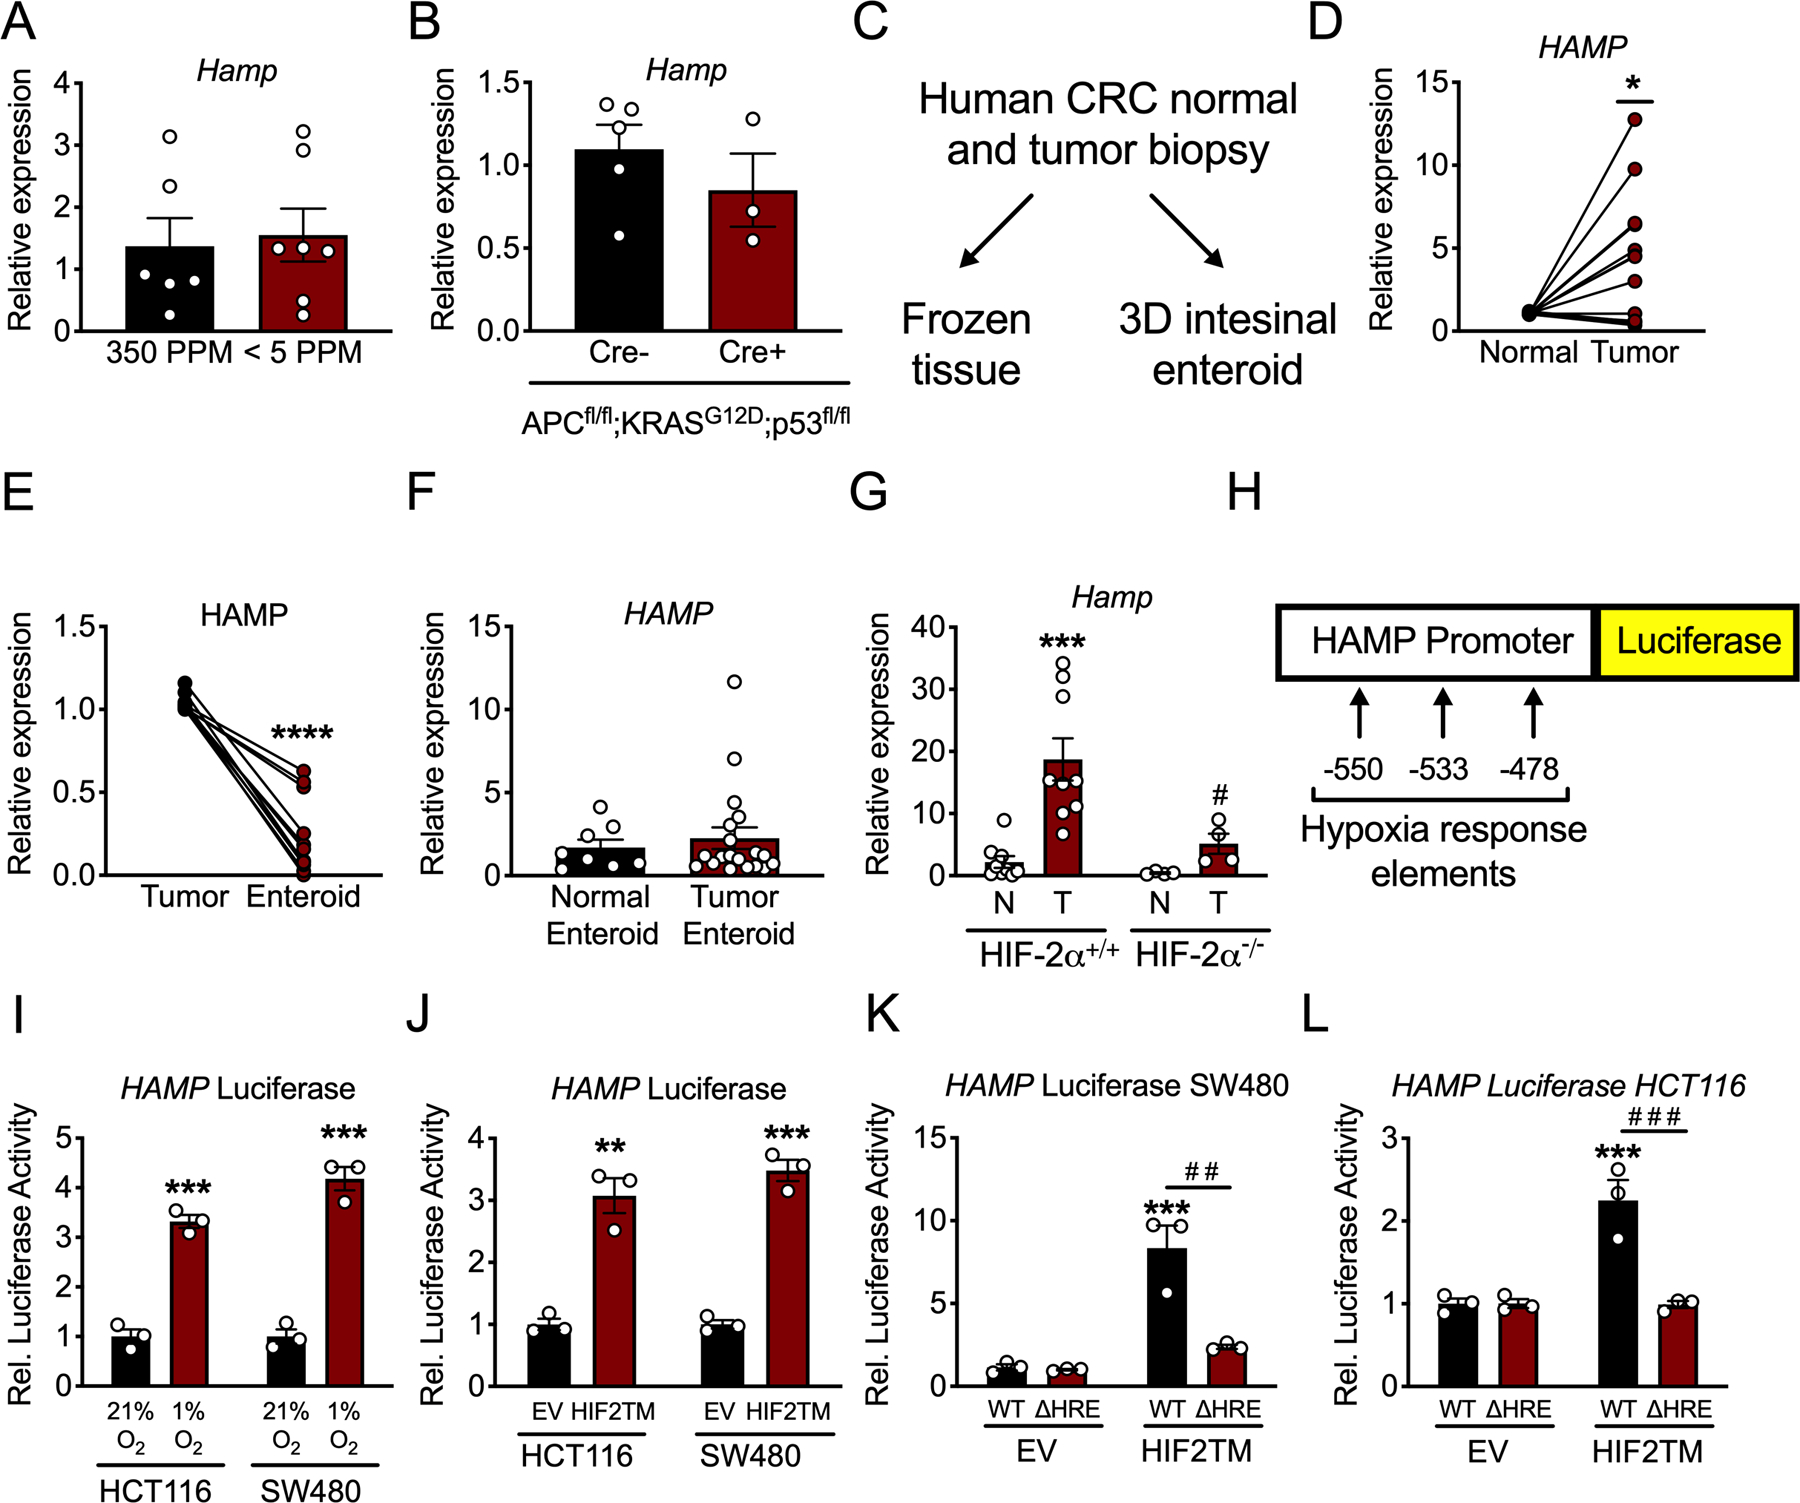
Figure 3. Hypoxia via HIF-2α activates hepcidin expression in CRC.

(A) qPCR analysis for hepcidin (Hamp) in the colon of mice that were on iron replete (350 PPM) or low iron (< 5 PPM) diets for three months (350 PPM N=6 and <5 PPM N=7 biologically independent animals). (B) qPCR analysis for Hamp in the colon of mice with inducible, colon epithelial deletion of APC and p53 and activation of KRAS for ten days (Cre- N=5 and Cre+ N=3 biologically independent animals). (C) Schematic for utilization of human CRC patient tumor biopsies. (D) qPCR for HAMP in paired human patient adjacent normal and CRC tumor tissue (N=13 paired, biologically independent samples, p=0.0114). (E) qPCR analysis for HAMP in in vivo tumor tissue and in vitro enteroids generated from the same biopsy tissue (N=11 paired, biologically independent samples, p<0.0001). (F) qPCR analysis for HAMP in entire library of normal and tumor patient-derived enteroids (Normal Enteroid N=8 and Tumor Enteroid N=19 biologically independent samples). (G) qPCR analysis of Hamp from a sporadic model of CRC in mice that were either wild-type for or deficient of HIF-2α (HIF-2α+/+ N=9 and HIF-2α−/− N=4 biologically independent samples from independent animals, HIF-2α+/+ normal vs tumor p=0.0006 and HIF-2α−/− normal vs tumor p=0.0108). (H) Schematic of luciferase reporter construct of 1.7 kb of the human hepcidin promoter, indicating location of hypoxia response elements (HREs). (I) Hepcidin promoter luciferase reporter activity in CRC-derived HCT116 and SW480 cells treated with either normoxia (21% oxygen)/hypoxia (1% oxygen) for 16 hours (HCT116 p=0.0003 and SW480 p=0.0003) or (J) an oxygen stable HIF-2α construct (HIF2TM) (HCT116 p=0.0021 and SW480 p=0.0002) (N=3 biologically independent cell replicates). (K and L) Hepcidin promoter luciferase reporter activity following transfection with HIF2TM as wild-type (WT) or deleted for HREs (ΔHRE) in SW480 (WT EV vs WT HIF2TM p=0.0003 and WT HIF2TM vs ΔHRE HIF2TM p=0.0012) and HCT116 cells (WT EV vs WT HIF2TM p=0.0007 and WT HIF2TM vs ΔHRE HIF2TM p=0.0006) (N=3 biologically independent cell replicates for I-L). Data represent the mean ± SEM. Significance was determined by 2-tailed, unpaired (A-B, F, I-J) or paired (D-E) t test, or by 1-way ANOVA with Tukey’s post hoc (G, K-L). *P < 0.05, ***P < 0.001, and ****P < 0.0001 comparing within a treatment group. # P < 0.05, # # P < 0.05, # # # P < 0.001 comparing between treatment groups.
