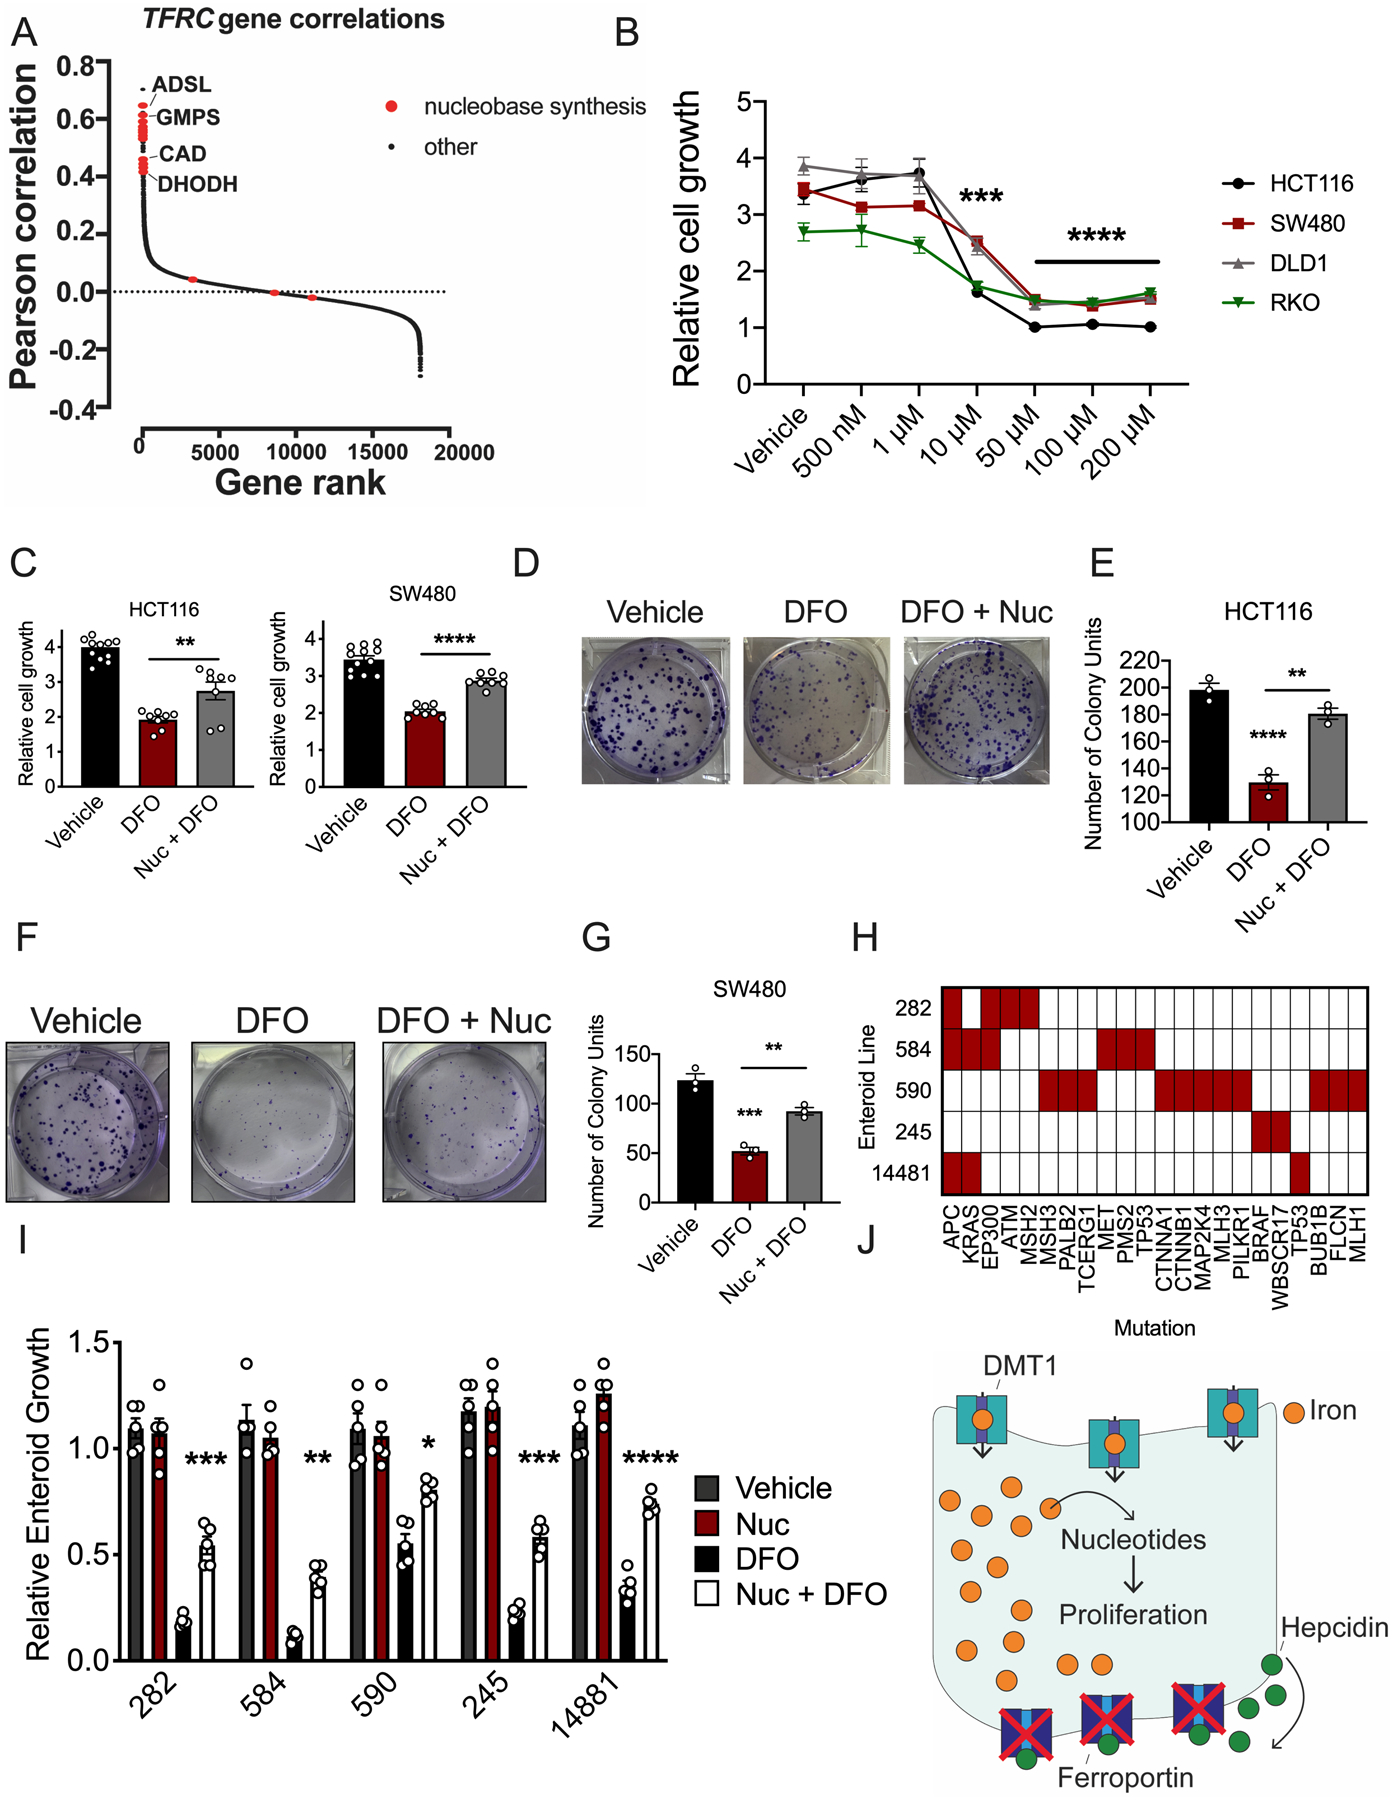
Figure 5. Nucleoside supplementation restores growth of two- and three-dimensional colorectal cancer models in the presence of DFO.

(A) Pearson correlations between essentiality scores in Dependency Map of each gene with TFRC, ranked from highest to lowest. Nucleobase synthesis genes are highlighted in red. (B) DFO dose response in human colorectal cancer (CRC)-derived cell lines 72 hours after treatment, using MTT (Vehicle N=6 and DFO N=4 biologically independent replicates in each cell line, 10μM all cell lines p=0.001, 50μM all cell lines p<0.0001, 100 μM all cell lines p 0.0001, 200μM all cell lines p<0.0001). (C) Nucleoside (100 μM) rescue of DFO (10 μM) growth inhibition in CRC-derived cell lines after 72 hours of co-treatment using MTT (Vehicle N=12 and DFO=8 biologically independent replicates in each cell line, HCT116 p=0.0055 and SW480 p<0.0001. (D) Representative crystal violet staining images (E) and quantification of HCT116 cells pretreated with vehicle or DFO (10 μM) and then treated with vehicle or a nucleoside cocktail for ten days (100 μM) (N=3 biologically independent cell replicates, Vehicle vs DFO p<0.0001, DFO vs Nuc + DFO p=0.0055). (F) Representative crystal violet staining images (G) and quantification of SW480 cells pretreated with vehicle or DFO (10 μM) and then treated with vehicle or a nucleoside cocktail for ten days (100 μM) (N=3 biologically independent cell replicates, Vehicle vs DFO p=0.0001, DFO vs Nuc + DFO p=0.0026). (H) Mutational landscape in small library of patient-derived tumor enteroids. (I) Nucleoside (100 μM) rescue of DFO (10 μM) growth inhibition in patient-derived tumor enteroids 7-days after treatment (N=5 biologically independent replicates in each treatment group, Enteroid 282 p=0.0004, Enteroid 584 p=0.0016, Enteroid 590 p=0.0234, Enteroid 245 p=0.0007, Enteroid 14881 p<0.0001. (J) Schematic of intratumoral iron being utilized for nucleoside production. Data represent the mean ± SEM. Significance was determined by 1-way ANOVA with Tukey’s post hoc (B-C, E, G, I). *P < 0.05, **P < 0.01, ***P < 0.001, ***P < 0.001, and ****P < 0.0001 comparing within cells lines or across treatment groups.
