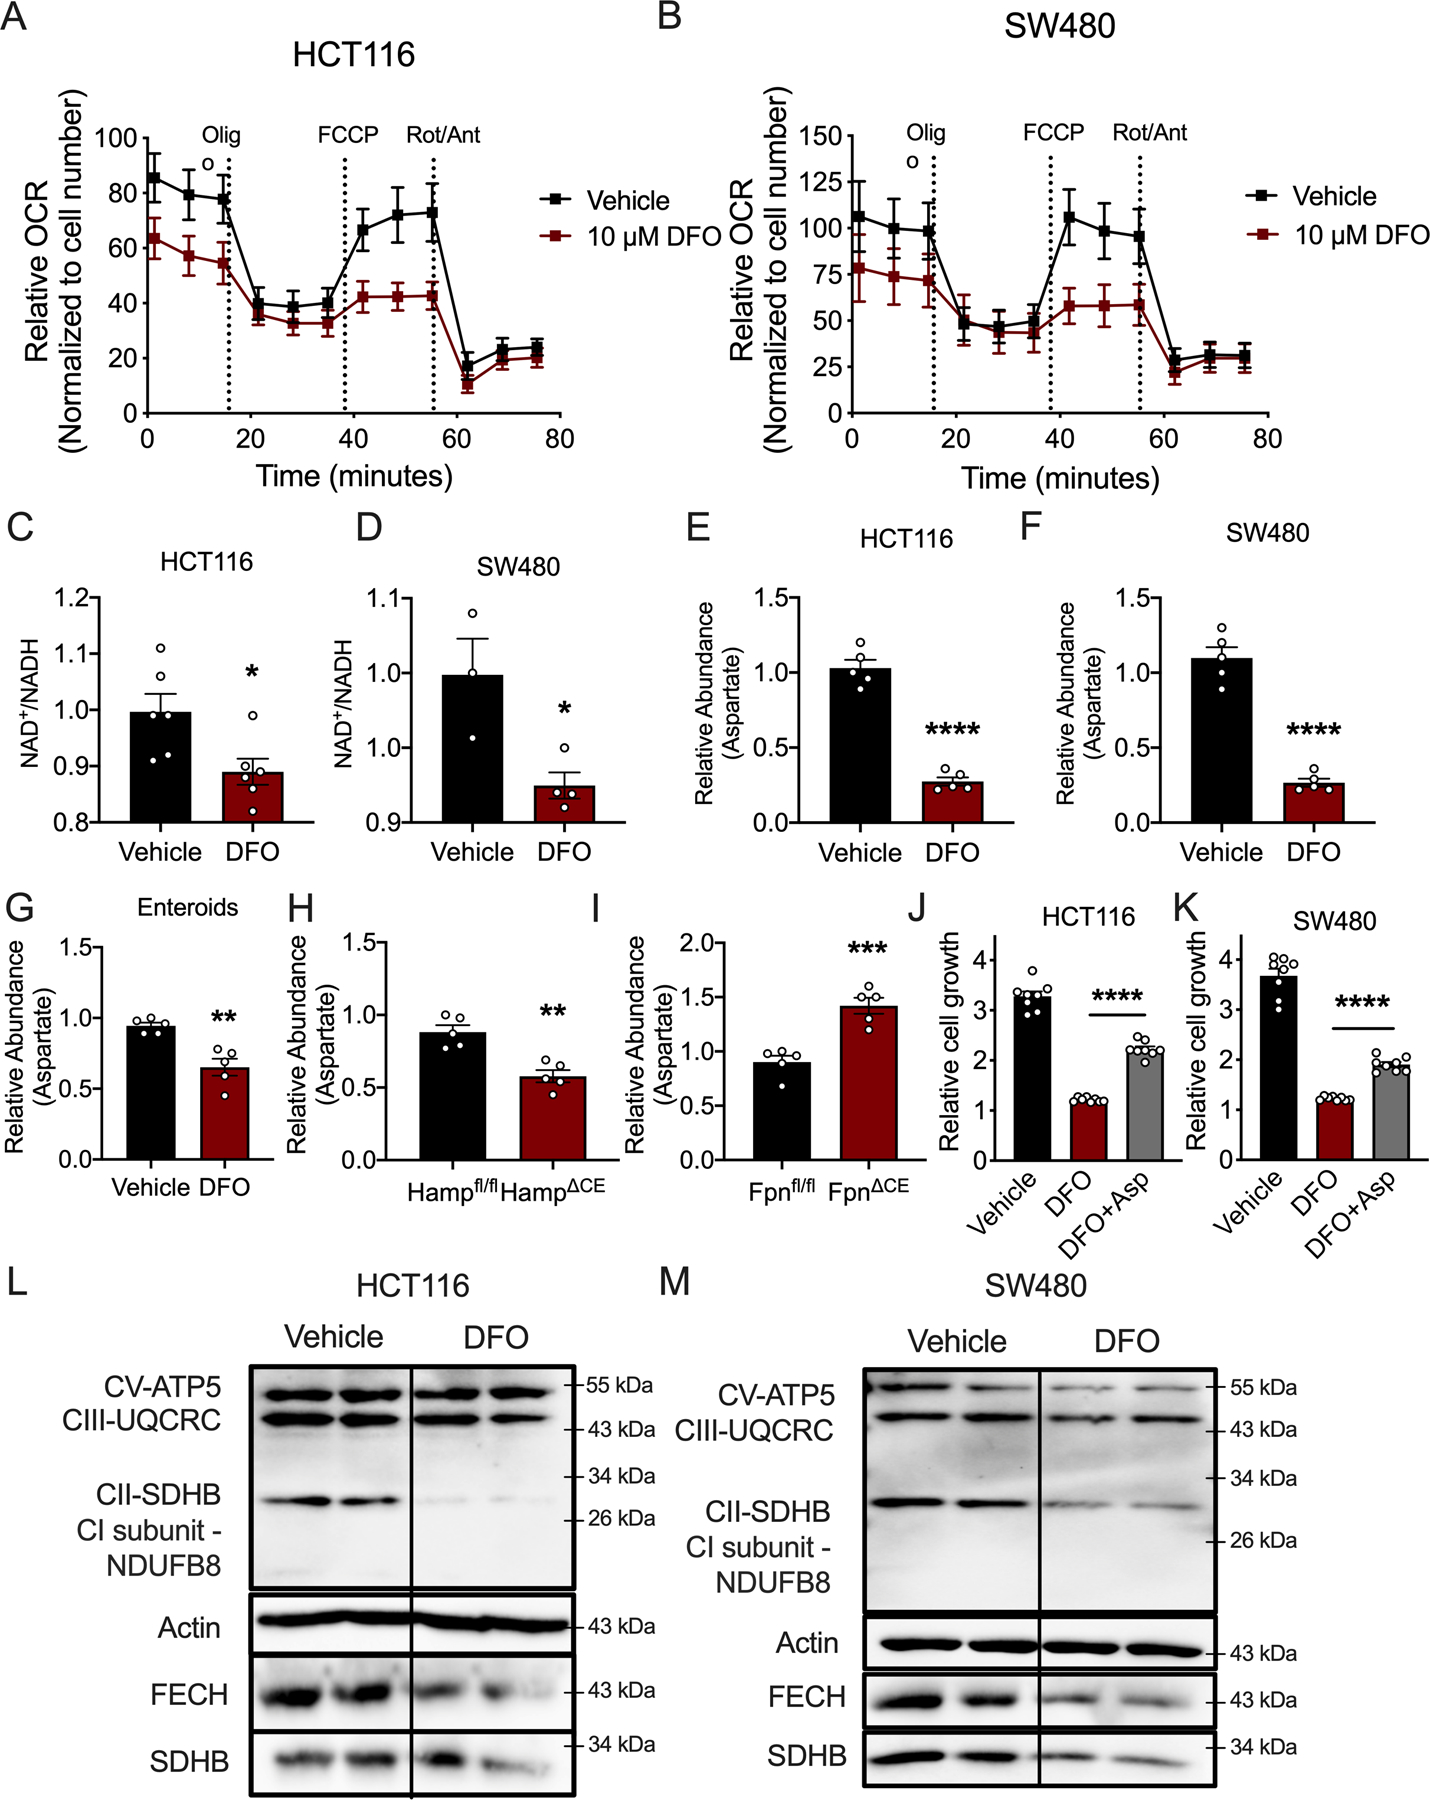
Figure 6. DFO-mediated iron depletion alters mitochondrial metabolism.

(A) Seahorse analysis of mitochondrial metabolism in HCT116 and (B) SW480 cells 24 hours after DFO administration (10μM) (N=4 biologically independent cell replicates for each treatment condition). (C) NAD+/NADH ratio in HCT116 (N=6 biologically independent cell replicates, p=0.0218) and (D) SW480 (Vehicle N=3 and DFO N=4 biologically independent cell replicates, p=0.0222) treated with DFO (10μM). (E) Aspartate levels in HCT116 cells (N=5 biologically independent cell replicates, p<0.0001) and (F) SW480 cells (N=5 biologically independent cell replicates, p<0.0001) treated with DFO (10μM). (G) Aspartate abundance in patient-derived enteroids treated with DFO (100μM for 72 hours) (N=5 biologically independent replicates, p=0.0019) and (H) sporadic tumors from wild-type or colon-specific hepcidin-deficient mice (Hamp) (N=5 biologically independent samples from independent animals, p=0.0014), and (I) sporadic tumors from wild-type or colon-specific ferroportin-deficient mice (Fpn) (N=5 biologically independent samples from independent animals, p=0.0006). (J) Cell growth in HCT116 cells (N=8 biologically independent cell replicates, p<0.0001) and (K) SW480 cells (N=8 biologically independent cell replicates, p<0.0001) following DFO treatment (10μM) with and without aspartate supplementation (100μM). (L and M) Western blot analysis of mitochondrial enzymes following 24-hours of DFO (10μM) treatment in HCT116 cells (L) and SW480 cells (M). Data represent the mean ± SEM. Significance was determined by 2-tailed, unpaired t test (C-I) or one-way ANOVA followed by Tukey’s post hoc (J and K). *P < 0.05, **P < 0.01, ***P < 0.001, and ****P < 0.0001 compared to vehicle or between genotypes.
