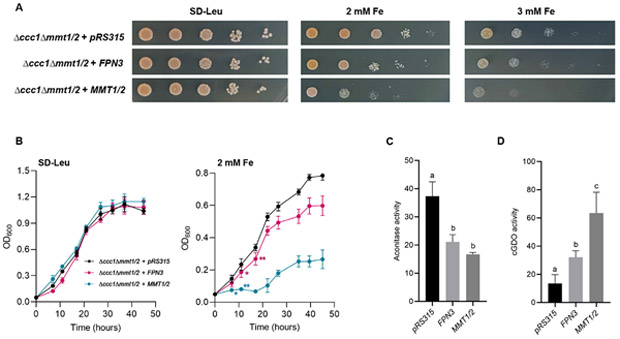
Figure 2. Heterologous expression of FPN3 in yeast.
(A) Spot assays in high iron media (SD-Leu with 2 mM and 3 mM Fe) or control media (SD-Leu) with Δccct1Δmmt1/2 cells expressing FPN3 or MMT1/2, or transformed with an empty vector, pRS315. (B) Growth assays with liquid culture with Δccct1Δmmt1/2 cells expressing FPN3 or MMT1/2, or transformed with an empty vector, pRS315. Significant differences compared to the negative control were determined by two-way ANOVA followed by Tukey’s multiple comparison test (*: p<0.05; **: p<0.001; n=6; Error bars = SD). From the third time point and beyond, cells expressing FPN3 or MMT1/2 were significantly different from the negative control (p<0.001) but labels were omitted for simplicity of the graph. (C) Aconitase activity (nmol/mg protein/min) of wild type (DY150) cells expressing FPN3 or MMT1/2 or transformed with an empty vector, pRS426. Significant differences were determined by one-way ANOVA followed by Tukey’s test and denoted with different letters (p<0.01; n=6; Error bars = SD). (D) cGDO activity (mmol/mg protein/min) of wild type (DY150) cells expressing FPN3, MMT1/2, or the empty vector, pRS315. Significant differences were determined by one-way ANOVA followed by Tukey’s test and denoted with different letters (p<0.01; n=6; Error bars = SD).

