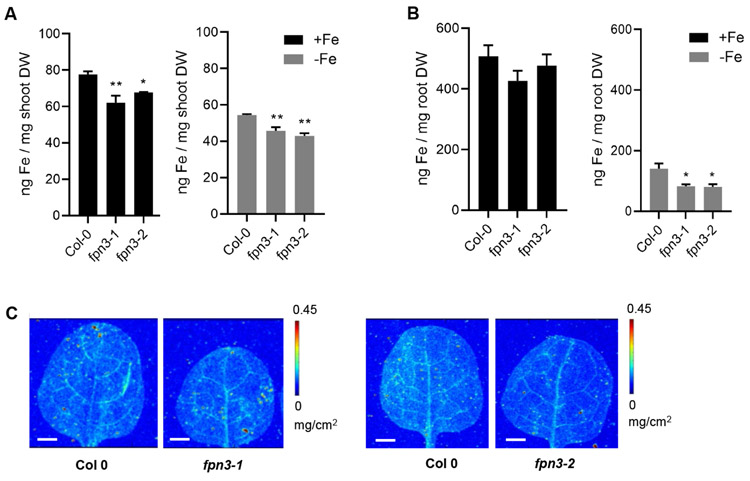
Figure 6. Elemental analysis of fpn3 shoots and roots.
(A) Iron content of shoot tissue from plants grown under iron sufficient (+Fe) and deficient (−Fe) conditions measured by ICP-MS. (B) Iron content of root tissue from plants grown under iron sufficient (+Fe) and deficient (−Fe) conditions measured by ICP-MS. Mean values of pooled quadruplicate ICP-MS samples are shown with error bars (SE). Significant differences compared to Col 0 are denoted (One-way ANOVA; Dunnett’s test; *: p<0.05; **: p<0.01). (C) Synchrotron x-ray fluorescence microscopy images of iron distribution in leaves of wild type (Col 0) and fpn3 leaves. The first true leaves of 22-day old plants grown in iron sufficient conditions were imaged at a resolution of 30 x 30 μm with 0.2 sec dwell time. Representative images of leaves from three individuals are shown. Scale bars = 1 mm.

