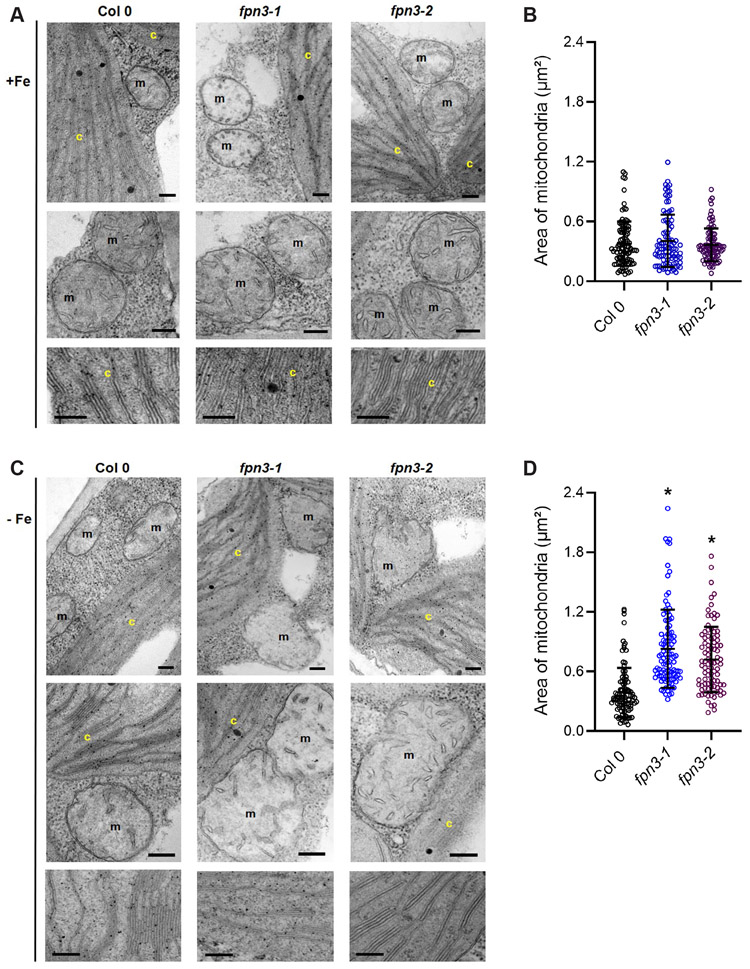
Figure 9. Mitochondria and chloroplast ultrastructure of fpn3.
(A) TEM images of the wild type, Col 0, fpn3-1, and fpn3-2 leaf sections with mesophyll cells from iron sufficient conditions. Close-up images of mitochondria (middle row) and thylakoids (bottom row) are shown. (B) Area of mitochondria from iron sufficient conditions. data point represents the quantified area from each mitochondrion section, and the lines represent mean values with SD. Ninety-four to 105 mitochondria from 38 to 41 cells were quantified. (C) TEM images of iron deficient wild type, fpn3-1, and fpn3-2 leaf sections with mesophyll cells. Chloroplasts (c) and mitochondria (m) are labeled in the images. Scale bars = 200 nm. (D) Area of mitochondria from iron deficient conditions. Each data point represents the quantified area from each mitochondrion section, and the lines represent mean values with SD. Ninety-six to 113 mitochondria from 40 to 57 cells were quantified. (one-way ANOVA; Tukey’s multiple comparison test’ *: p<0.01).

