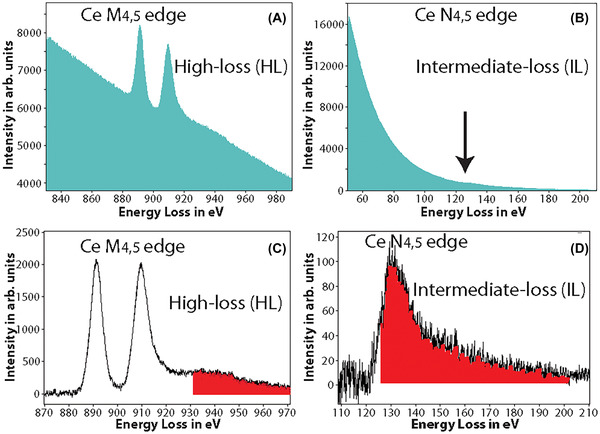
FIGURE 2.

(A) The raw spectrum acquired at the high‐loss M4,5 edge of Ce, the two white line peaks with onset ∼883 eV is clearly visible. (B) The raw spectrum acquired at the intermediate‐loss N4,5 edge of Ce, edge is barely visible as a small bump in the spectrum (see arrow direction). (C) The background subtracted spectrum of (A), the M4,5 edge of Ce has a high signal‐above‐background ratio (SBR). The red‐shaded region shows the Ce extended energy‐loss fine structure (EXELFS) bleed into the Pr edge. (D) The background subtracted spectrum of (B), the N4,5 edge of Ce is now clearly visible, though with a much lower SBR. The red‐shaded region shows the part of the Ce edge that bleeds into the Pr edge
