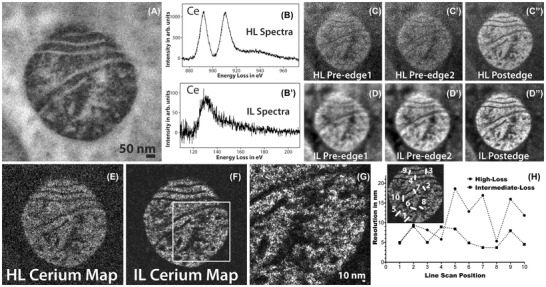
FIGURE 3.

(A) Conventional TEM image of mitochondrial matrix‐APEX2 labelled with Ce2‐DAB (second generation). (B) The background subtracted high‐loss spectrum acquired on the sample showing the M4,5 edge of Ce. (B’) The background subtracted intermediate‐loss spectrum acquired on the sample showing the N4,5 edge of Ce. (C), (C’), (C’’) The preedge 1, preedge 2 and postedge acquired for the high‐loss M4,5 cerium edge at 815 eV, 855 eV and 899 eV, respectively. Each energy‐plane is a sum of 3 images acquired at an exposure of 100 sec/image. (D), (D’), (D’’) The preedge 1, preedge 2 and postedge acquired for the intermediate‐loss N4,5 cerium edge at 75 eV, 98 eV and 138 eV, respectively. Each energy‐plane is a sum of 29 images acquired at an exposure of 10 seconds/image. The dose and dose rate were nearly the same for both the high‐loss and intermediate‐loss acquisitions. (E) The high‐loss Ce elemental map. (F) The intermediate‐loss Ce elemental map. (G) Magnified view of the intermediate‐loss Ce elemental map. (H) The relative resolution comparison between the high‐loss and the intermediate‐loss Ce elemental map, measured by the width of the intensity between 25% and 75% of the peak, for 10 different regions taken exactly the same position of the sample for both the maps (see the inset). To enhance image display, a Gaussian blur of radius 1 was applied to the conventional image and Gaussian blur of radius 2 was applied to the EFTEM images and maps
