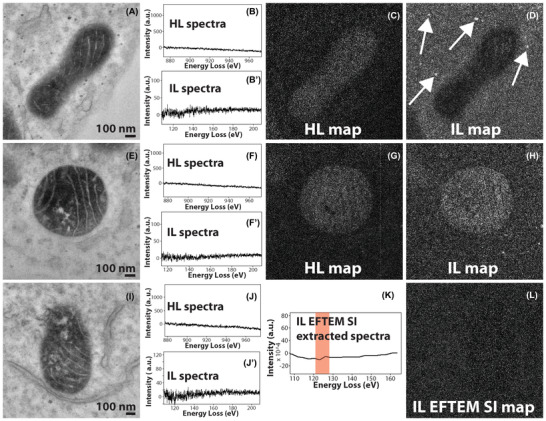
FIGURE 4.

(A) Conventional TEM image of the control sample of mitochondrial matrix‐APEX2 labelled with plain DAB (no Ce or any other lanthanides). (B), (B’) The background subtracted high‐loss and intermediate‐loss spectrum acquired on the mitochondrial matrix region of (A), confirming the absence of Ce in the sample. (C) The high‐loss elemental map computed by the 3‐window method, for preedge 1, preedge 2 and postedge obtained for a slit width of 30 eV at 815 eV, 855 eV and 899 eV, respectively. The image shows a positive contrast for the matrix region, implying an under subtraction of the background. (D) The intermediate‐loss elemental map computed by the 3‐window method, for preedge 1, preedge 2 and postedge obtained for a slit width of 20 eV at 75 eV, 98 eV and 138 eV, respectively. The image shows a negative contrast for the matrix region, implying an over subtraction of the background. However, the spherical stained structures show a positive contrast (see the arrows), implying inconsistencies in background subtraction. (E) Conventional TEM image of a different region of the same control sample. (F), (F’) The background subtracted high‐loss and intermediate‐loss spectrum acquired on the mitochondrial matrix region of (D), confirming the absence of Ce in the sample. (G) The high‐loss elemental map computed by the 3‐window method, for preedge 1, preedge 2 and postedge obtained for a slit width of 30 eV at 815 eV, 855 eV and 899 eV, respectively. The image shows a positive contrast for the matrix region, implying an under subtraction of the background. (H) The intermediate‐loss elemental map computed by the 3‐window method, for preedge 1, preedge 2 and postedge obtained for a slit width of 15 eV at 84 eV, 102 eV and 135 eV, respectively. The image shows a positive contrast for the matrix region, implying an under subtraction of the background. (I) Conventional TEM image of a different region of the same control sample. (J), (J’) The background subtracted high‐loss and intermediate‐loss spectrum acquired on the mitochondrial matrix region of (G), confirming the absence of Ce in the sample. (K) The virtual intermediate‐loss spectrum extracted from the EFTEM SI image‐series, corroborating the results in (H’). (L) The intermediate‐loss elemental map computed by the EFTEM SI method, for an acquisition acquired from 90 to 150 eV, for a slit width of 8 eV and an energy step of 3 eV. The signal was integrated from the region represented by the red box in (K). The image shows a no contrast and only noise for the matrix region, implying a correct subtraction of the background. To enhance image display, a Gaussian blur of radius 1 was applied to the conventional images and Gaussian blur of radius 2 was applied to the EFTEM maps
