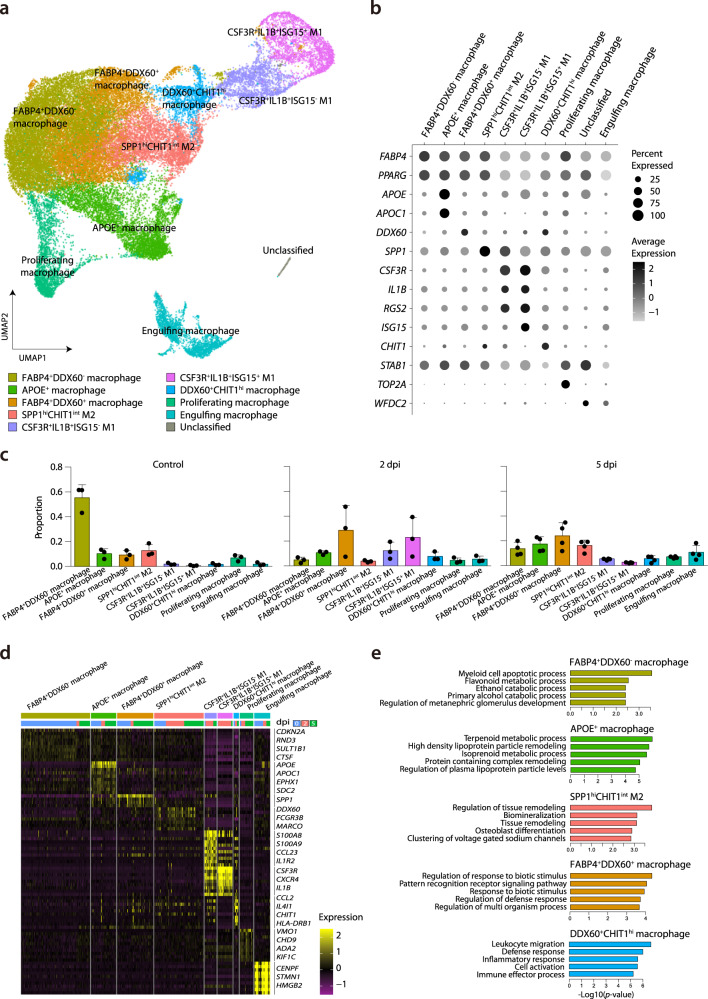
Fig. 3. Sub-clustering analysis of macrophages.
a UMAP plot of the macrophage subpopulations in all groups, colored to show cluster information. b Ten different clusters and their specific marker gene expression levels, with brightness indicating log-normalized average expression, and circle size indicating the percent expressed. c Proportion of each macrophage cell type at uninfected control (n = 3), 2 dpi (n = 3), and 5 dpi (n = 4). The height of bars indicates mean and error bars indicate standard deviation. d Heatmap of cluster-specific differentially expressed genes (DEGs), for each macrophage cell type (n = 9). The color indicates the relative gene expression, and representative genes are shown together. e Bar plots showing −log10(p value) from enrichment analysis of representative GO biological pathways among FABP4+DDX60− macrophages (resting tissue macrophages), APOE+ macrophages, SPP1hiCHIT1int M2 (potentially profibrogenic), FABP4+DDX60+ macrophages (activated tissue macrophages), and DDX60+CHIT1hi macrophages (monocyte-derived infiltrating). The p values are calculated from a theoretical null distribution with a two-sided Wilcoxon signed-rank test. Source data are provided as a Source Data file.

