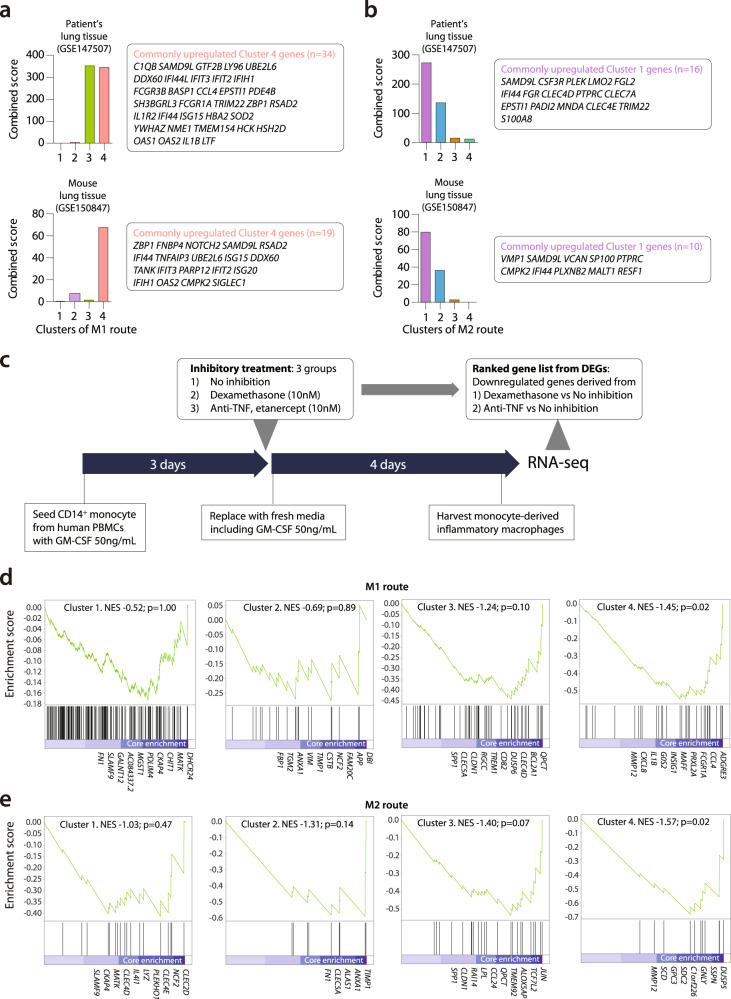
Fig. 5. GSEA of gene modules originated from the M1 route and M2 route.
a, b Gene set enrichment analysis (GSEA) of clusters 1–4 of the M1 route a. and M2 route b. using public transcriptome data, including post-mortem lung tissue from a COVID-19 patient (GSE147507) and lung tissue from a SARS-CoV-2-infected mouse (GSE150847). For calculating combined scores, upregulated genes derived from COVID-19 patients’ lung tissue and SARS-CoV-2-infected mouse lung were compared to the marker genes of pseudo time clusters of M1 or M2 route, which was calculated from the p value obtained using Fisher’s exact test and the z-score (see “Methods”). Commonly upregulated genes are listed in the box right side of each bar graph. c Experimental design to make dexamethasone and etanercept responsive gene sets for GSEA of clusters 1–4 of the M1 and M2 route. d, e GSEA of clusters 1–4 of the M1 route (c) and M2 route (d) using ranked gene list originated from dexamethasone-downregulated DEGs derived from in vitro experiment described in (c). The name of genes included as core enrichment was listed, NES normalized enrichment score. The p values of the combined score are calculated with a two-sided Fisher’s exact test. The p value of GSEA is the probability under the null distribution calculated by the permutation test. Source data are provided as a Source Data file.

