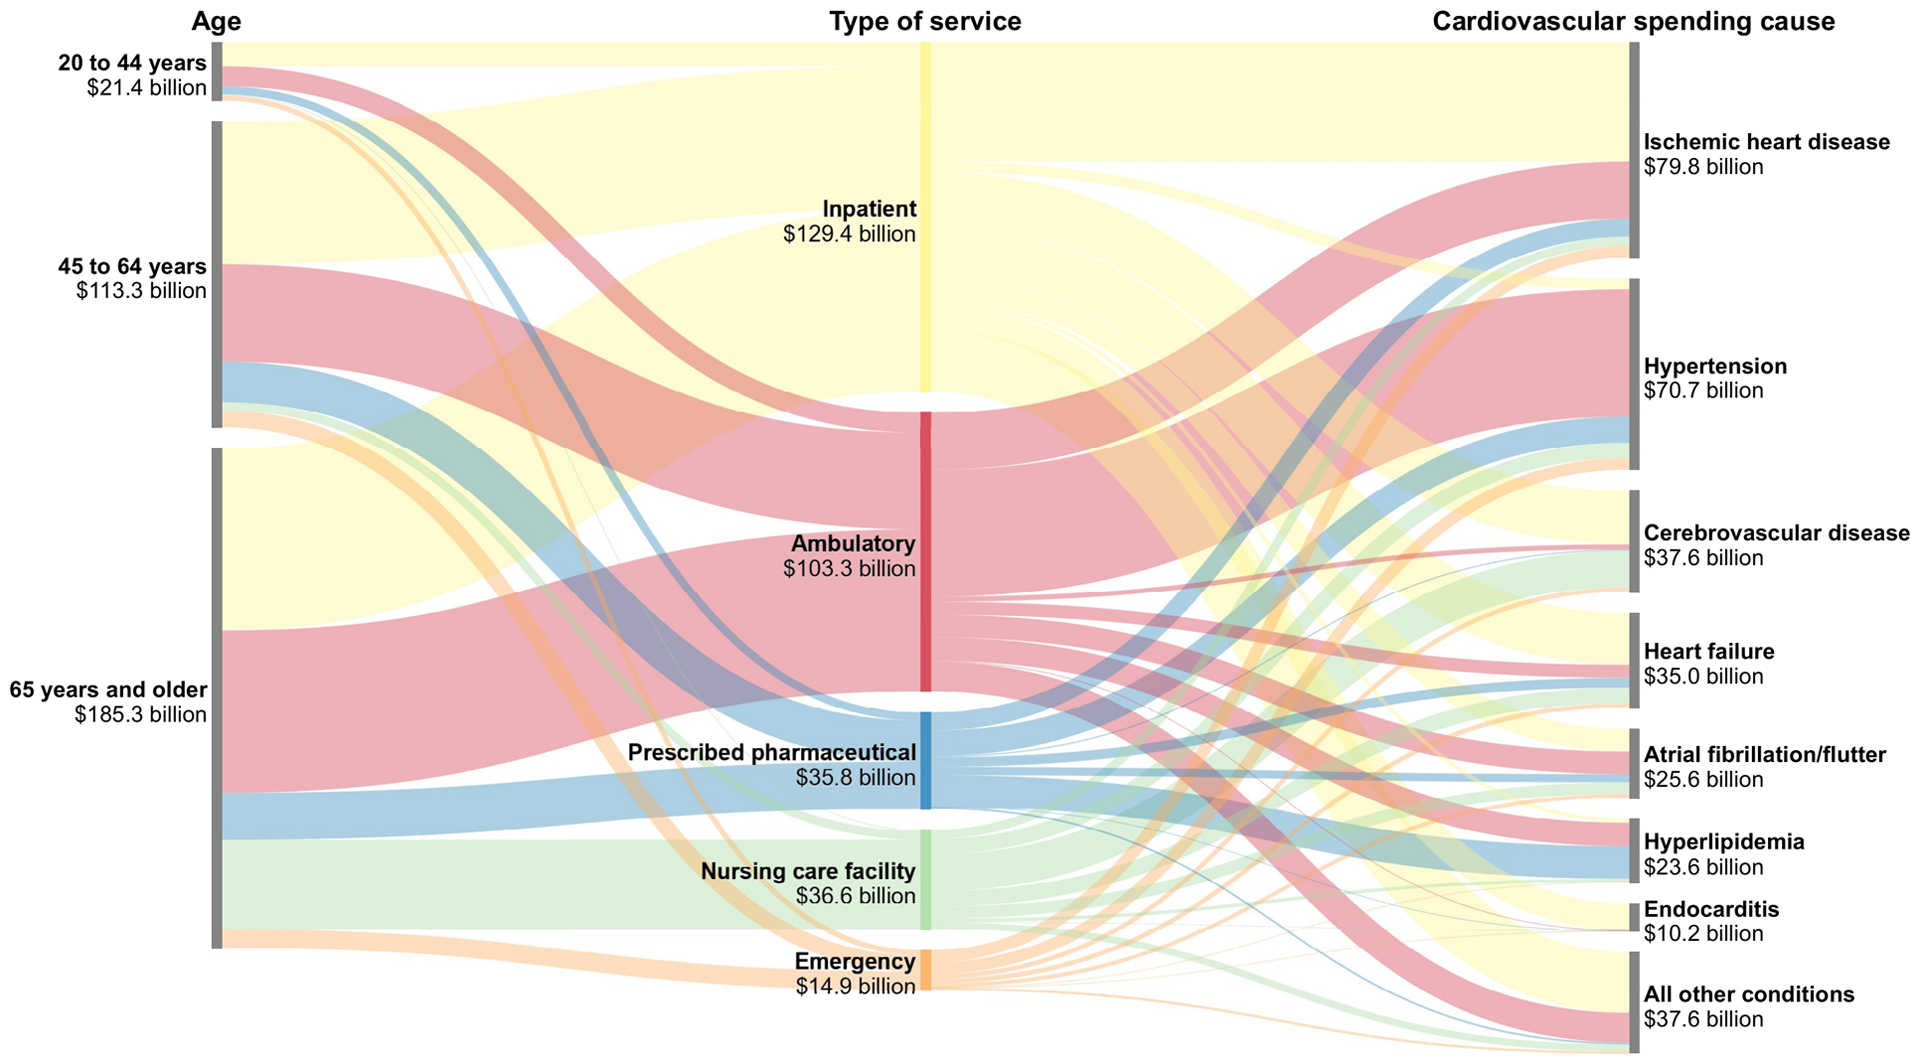
Figure 1. Total cardiovascular spending in 2016 by payer, age, type of service, and cardiovascular cause.

Notes: The figure shows the distribution of cardiovascular spending in 2016 by age, type of service, and cardiovascular spending cause (i.e., each column sums to the total cardiovascular spending in 2016). The first column shows the distribution of cardiovascular spending across age groups, and the pathways connecting the first and second columns indicate the cardiovascular spending by type of service within each age group. Similarly, the second column shows the distribution of cardiovascular spending across type of service, and the pathways connecting to the third column indicate the cardiovascular spending causes by type of service. The third column shows the distribution of cardiovascular spending by cardiovascular spending cause. “All other conditions” indicates all causes for which less than $10 billion was spent individually. All estimates are in 2016 USD.
