


Figure 2. Total and per capita cardiovascular spending in 2016 by type of care and payer type.
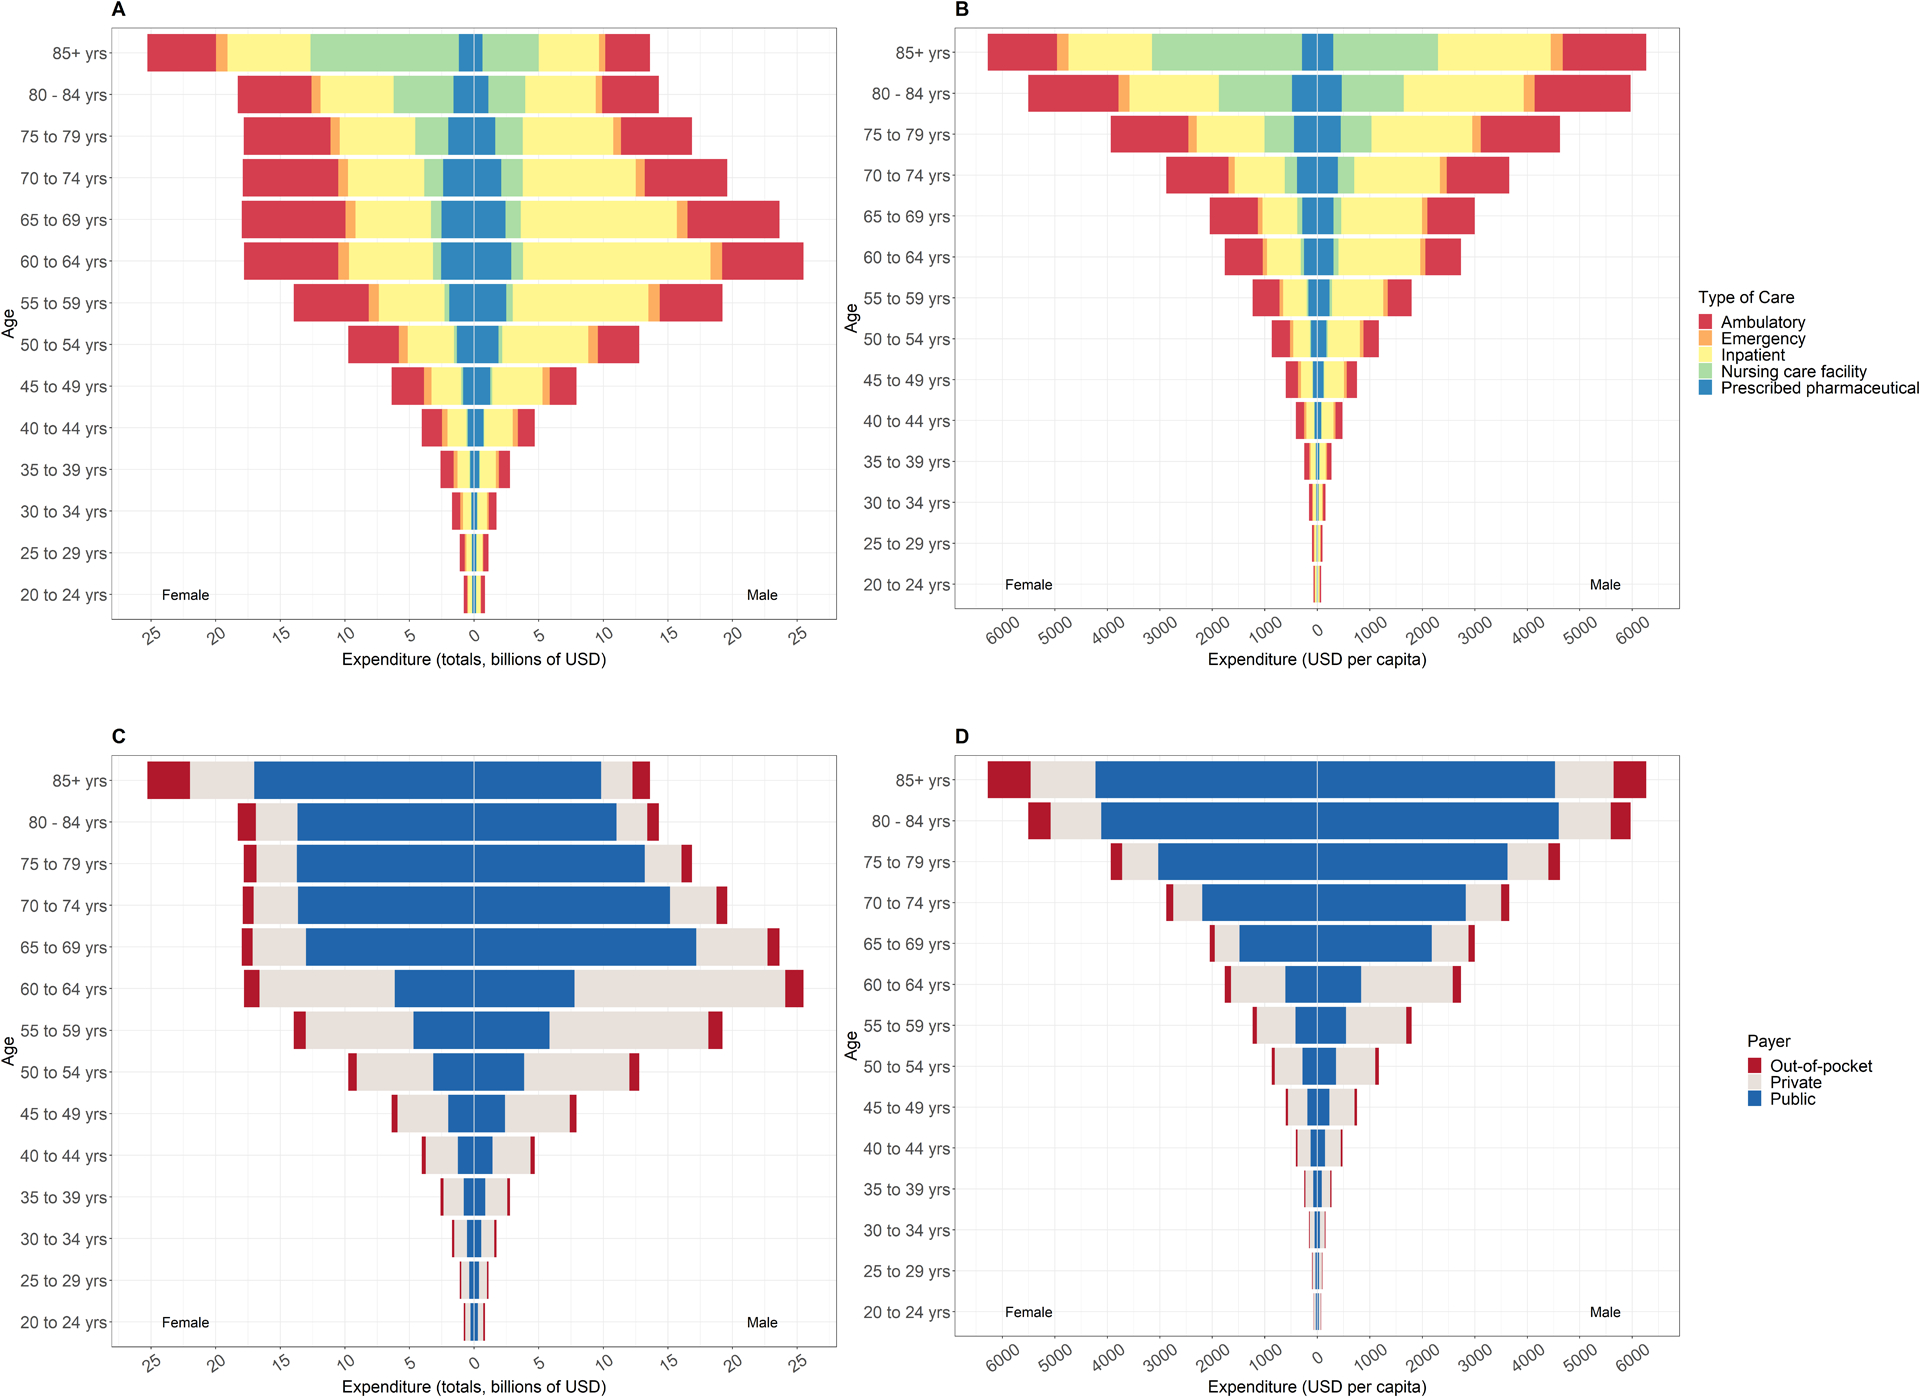
Notes: This figures shows 2016 cardiovascular spending. Panel A shows billions of USD by sex and type of care. Panel B shows USD per capita by sex and type of care. Panel C shows billions of USD by sex and payer. Panel D shows USD per capita by sex and payer. The figure shows 2016 absolute and per capita spending for each age and sex group, disaggregated by type of care and payer.